 I head the
Add Graal JIT Compilation to Your JVM Language in 5 Easy Steps, Step 5
Step 5: Optimizing the Interpreter for Compilation
In the previous post of this series, we completed the support for executing Mandelbrot and saw that our interpreter reaches with the help of the Graal compiler the same performance as Golo’s bytecode-based implementation.
In this post, we first introduce how the Graal compiler works for our interpreter, and then we are going to use IGV, a viewer for Graal’s compilation graphs, to identify a performance bottleneck and optimize it.
Introduction to Graal’s Compilation Approach
Conceptually, Graal is a pretty classic compiler. It works on a input program, applies all kind of optimizations structured in different compiler phases and based on that generates native code for the execution.
The way we use Graal is however a little unusual. We use it as a meta-compiler. So, instead of applying it to a specific input program, we apply it to an interpreter that executes a specific program. So, Graal is not specific to a language, but can compile any language that is implemented as a Truffle interpreter.
The compilation works very similar to many other just-in-time compilers, i.e., compilers that are executed at runtime based on a program’s behavior. Graal will consider the compilation of methods for our Golo program once a certain execution threshold is reached. This usually means, when a Golo method was executed 1000 times, Graal will start compiling and optimizing it.
For our benchmark, it eventually compiles the mandelbrot(size) method that we saw in the previous posts. This method is represented as AST and Graal knows that the relevant entry point is the execute(.) method of the RootNode. So, it takes the AST and the code of the execute(.) method to start compiling. In the first step it partially evaluates the code of this method. In that process it will reach for instance field reads from AST nodes or method calls on these nodes. In these cases it can fill in the blanks based on the concrete AST it got. And since our AST already specialized itself to contain the most specific operations possible, this process works very well. In the end, this partial evaluation constructs the compilation unit. This means it gathers, some say inlines, all code that is reachable from the initial execute(.) method. This is a greedy process, so it inlines as much as possible.11 In some cases this is problematic. For more control, the @TruffleBoundary annotation can be used to stop inlining. The goal is to know as much about the execution of this method as possible. When it finds calls to other Golo functions, it uses a heuristic to decide whether to inline these, too. This means we end up with a large set of code that describes which operations our program performs and on which we can apply classic compiler optimizations. Generally, this process is pretty successful in removing all the overhead of the interpreter and yield native code that runs fast.
However, as we have seen in the previous post, we did still have an overhead of about 5x over Java, which is not really impressive. So, let’s see why this is the case.
Setting up Graal and Golo
So far, we have not discussed the more practical issues of how to obtain the Graal compiler, it’s tool, and Golo. Let’s rectify that now. To investigate our performance issues, we need IGV. It is also known as the Ideal Graph Visualizer and is currently maintained as part of the Graal compiler. And we need of course the Golo implementation. In case you are more interested in the later discussions than following along yourself, feel free to skip to the next section.
First, we want the GraalVM binaries. The GraalVM is a release of the Graal compiler together with Oracle’s language implementations for JavaScript, R, and Ruby. It can be downloaded from the Oracle Technology Network.
Unfortunately, IGV is not part of this release, so, we also need the source repository. This is a little more involved. We need the mx tool that is used for obtaining dependencies, building, and executing the development builds of Graal. As many OpenJDK projects, this project also uses Mercurial as version control system.
The following steps should result in a usable setup:
mkdir graal-ws; cd graal-ws             # create and change to a working folder
hg clone https://bitbucket.org/allr/mx  # get mx
./mx/mx sclone http://hg.openjdk.java.net/graal/graal-compiler  # get graal
Note, this can take quite a while. The repositories are rather large.
In the meanwhile, we can already get and compile the Golo branch with support for Mandelbrot. Use git to checkout the truffle/mandelbrot branch in the graal-ws folder. And then, use the provided Gradle script to compile everything:
git clone -b truffle/mandelbrot https://github.com/smarr/golo-lang.git
cd golo-lang
./gradlew instDist  # warning: this will download all dependencies
After we obtained the above mentioned GraalVM binary, the source repository, and Golo, we are all set for investigating the performance of our Golo interpreter.
How to use IGV to Inspect Compilation Results
The next step is to run our benchmark. Assuming that the GraalVM release was put into the graal-ws folder, we should be able to execute the following:
../GraalVM-0.9/bin/java -classpath build/install/golo/lib/golo-3.0.0-incubation-SNAPSHOT.jar:build/install/golo/lib/asm-5.0.4.jar:build/install/golo/lib/jcommander-1.48.jar:build/install/golo/lib/txtmark-0.13.jar:build/install/golo/lib/json-simple-1.1.1.jar fr.insalyon.citi.golo.cli.Main golo --truffle --files samples/mandelbrot.golo
This is the full command to run the Truffle interpreter on the GraalVM. Thus, it includes the classpath with all runtime dependencies, as well as the Golo command with the --truffle option to execute the samples/mandelbrot.golo file.
The output of the resulting execution should show that the Mandelbrot benchmark is executed 100 times.
Run IGV, Run Benchmark with IGV Output
At this point, we should be able to execute the Mandelbrot benchmark. Now, we are looking into understanding what it is doing. For that we use IGV. To start it, we need a new terminal and change to the graal-compiler folder, and start it using mx:
cd graal-compiler
../mx/mx igv
It might take a bit, but eventually a Java desktop application should start up. Once it is running, we can run the benchmark again, but this time asking it to dump all of the compiler information, which is then displayed by IGV:
../GraalVM-0.9/bin/java -Djvmci.option.Dump=Truffle,TruffleTree \
  -classpath build/install/golo/lib/golo-3.0.0-incubation-SNAPSHOT.jar:build/install/golo/lib/asm-5.0.4.jar:build/install/golo/lib/jcommander-1.48.jar:build/install/golo/lib/txtmark-0.13.jar:build/install/golo/lib/json-simple-1.1.1.jar \
  fr.insalyon.citi.golo.cli.Main golo --truffle --files samples/mandelbrot.golo
After completion, IGV should roughly the following:
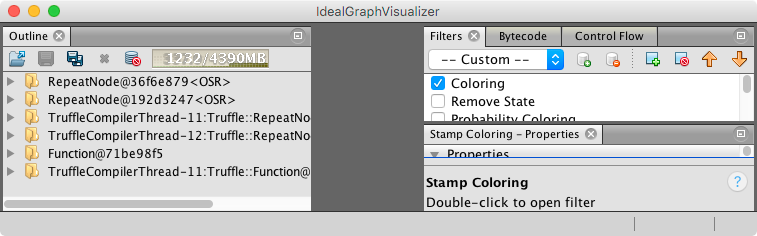
In the outline pane on the left, we see six folders, which correspond to three compilation requests Graal received during the execution of the benchmark. At the top of the list, we see two compilations named RepeatNode. These correspond to loop bodies in the mandelbrot(.) method and the folder contain the concrete AST that was compiled. Then we see two entries from TruffleCompilerThreads, that are also about the RepeatNode. These folders contain the compiler graph. We will ignore all four of these folders and focus on the last two ones.
The last two folder correspond to the whole mandelbrot(.) method. The folder name Function@... is contains the AST and the folder from the TruffleCompilerThread contains the compiler graph.
Inspecting the AST
Let’s first have a brief look at the AST that was compiled:
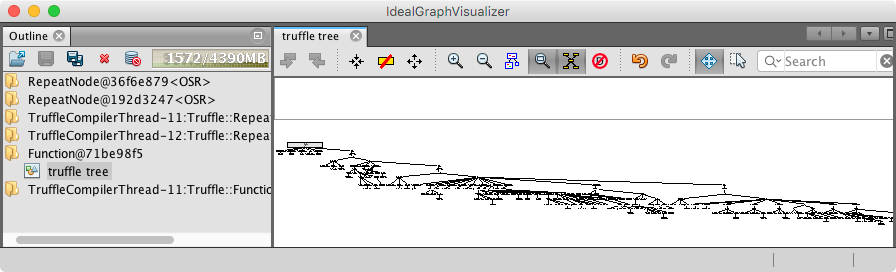
The screenshot here shows the satellite view (icon of magnifying glass in the middle). When we are in the normal view, we can navigate over the method, and inspect nodes. The right hand side of IGV should show a property window with details to the nodes. For instance the LocalVariable nodes contain the details on the slot object they hold, and thereby the variable names.
In general, each AST node shows it subnodes/child nodes. So, the LocalVariableWriteNodes refer to the value expression that returns the value to be written. At the beginning of the method that corresponds to the literals defined in the program.
When looking for instance at the LessThanNode, we see an IntegersNode_:
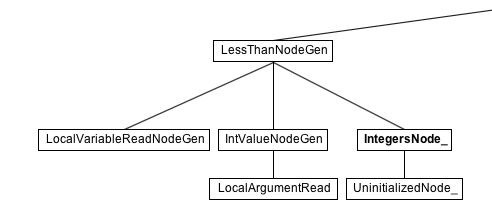
This IntegersNode_ is generated by the TruffleDSL for the case that all arguments are int values. Thus, it corresponds to the @Specialization we implemented previously. Note also the UninitializedNode_ below it. In case the arguments should change and for instance lead to a comparison of floating point numbers, the DSL provides us with the support to handle this kind of polymorphism. Exploring the graph further would reveal that the mandelbrot(.) method is very well behaved and all operations only require a single specialization. So, it is ideal for compilation.
In general, a look at the Truffle AST is useful to get a very high-level overview and to confirm initial assumptions about what gets compiled. As we will see in the next step, this high-level view is unfortunately not preserved when looking at the compiler graphs.
Inspecting the Graal Compilation
When we open the last folder named TruffleCompilerThread..., we see two folders and one graph in-between the two. The first folder contains the details of how the partial evaluation of the AST is performed.
In the screenshot below, we see the initial method that was sent to compilation:
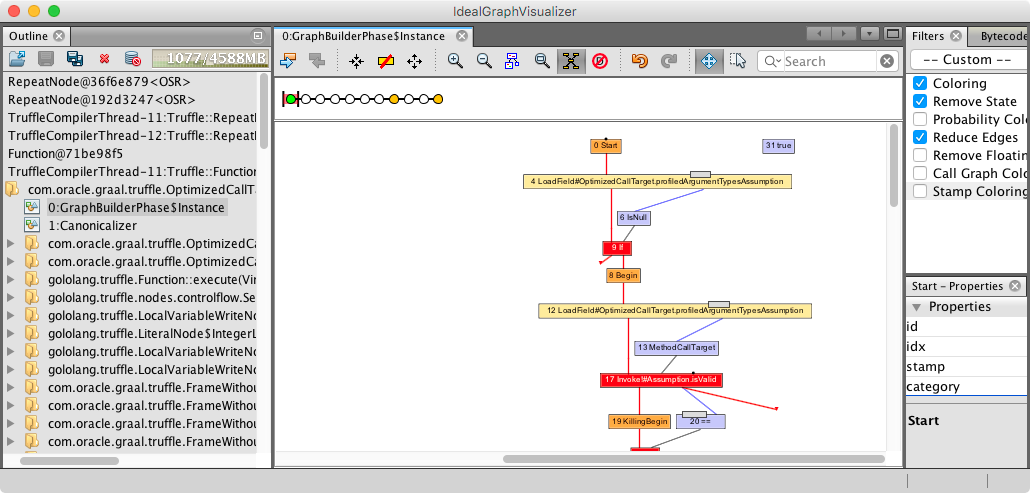
To make the graph a little more readable, we select in the filter pane on the right the option of Coloring, Remove State, and Reduce Edges. Since those graphs are typically very complex, these simplifications help to get an overview of where is what.
In the graph, we see now the Start node and then various other ones. The red edges indicate control flow between those nodes, and the blue and black edges correspond to data dependencies. What we can read from this graph is that Truffle actually does argument type profiling for all Truffle methods. This is a very generic and usually beneficial optimization. Since we pass only untyped Object arrays, the additional type information helps the optimizer by providing the missing information.
At the bottom of the screenshot, we further see a red box that corresponds to the invoke of the isValid() method. Such method calls will typically be inlined during this partial evaluation process.
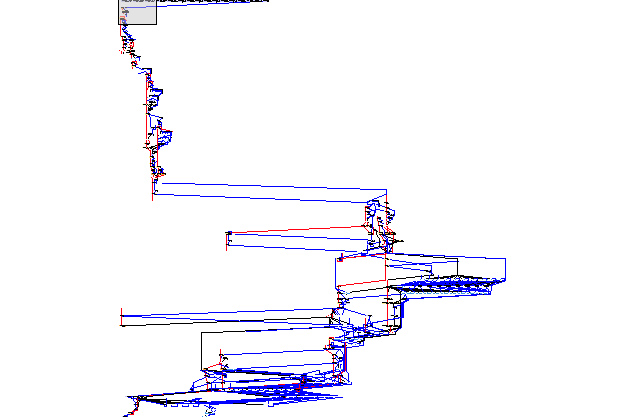
The screenshot above shows the whole graph after the partial evaluation phase. It ended up being quite complex, and the nodes are way too small to be distinguishable, but with a little practice, one can spot the loops.
So, let’s have a look at the second folder. This one contains the output for the various optimization passes applied by Graal. The list looks roughly something like this:
 0: initial state
 1: Canonicalizer
 2: Inlining
 3: DeadCodeElimination
 4: Canonicalizer
...
17: DominatorConditionalElimination
18: IterativeConditionalElimination
...
31: LoopFullUnroll
...
36: After inlining snippet HotSpotMethod<BoxingSnippets.doubleValue(Double)>
37: After lowering -100...|Unbox...
...
120: After inlining snippet HotSpotMethod<BoxingSnippets.intValueOf(int)>
121: After lowering -100...|Box...
...
...
186: After inlining snippet HotSpotMethod<NewObjectSnippets.allocateInstance(...)>
187: After lowering -100...|NewInstance...
...
The names of the phases give hints of what the change should be with respect to the previous graph. It includes further inlining, dead code elimination, loop unrolling, and many other classic compiler optimizations.
One thing that sticks out here however are almost a hundred passes related to boxing and unboxing of integer and double values. And later, we see another 60 or so passes that relate to object instantiation. This looks very strange. Our benchmark should mostly work on primitive numbers, here we really would not expect boxing or allocation going on. After all, Mandelbrot is a numerical benchmark. So, let’s investigate that closer.
I chose to open the phase 28, the result after running the Canonicalizer. This is very early in the process, and the graph should now be in a normalized form. Browsing a little over it, trying to see where all those boxing operations come from, I chose to investigate some Box operation somewhere in the middle. I picked the one that has the number 11510 in my graph. Double clicking on it hides the whole rest of the graph in shows only the remaining siblings. From here I started to explore the context of this boxing operation. As a parent node, we see a subtraction operation, with the constant 1.5 as an input, as well as a division as input that itself got a multiplication with the constant 2.0 as input. The other input to the division is an unbox operation. This all does not look very promising.
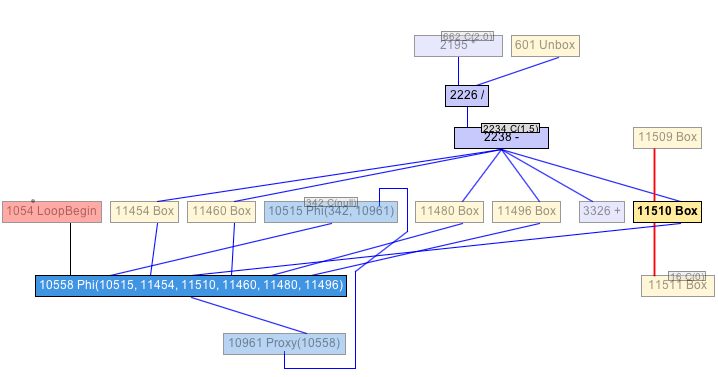
With those fragments of information, I’d say this piece of the graph corresponds to the following line of our mandelbrot(.) function:
var cr = (2.0 * doubleValue(x) / size) - 1.5
With that in mind, we can verify that the unbox operation corresponds to the reading of size, which is the function’s argument, and thus, the value is stored as an object in an array. And, exploring the graph, we see the corresponding LoadIndexed at index 0. Ok, so, that’s expected, and we can’t really do something about that.
Now, why is the boxing operation there? A Phi node depends on the result of it, and that itself goes into a value proxy node, which seems to have another dependency of another Phi node, which then again is also the input for the Phi node that has the boxing operation a dependency.
What we can’t see here at this stage in the graph is that the operations on the frame object, i.e., reading and writing of local variables has been converted to pure data dependencies. So, that ideally, there are not actual store operations but operations can consume the temporary results directly.
At this point, I would venture the guess that what we see here is the assignment to the cr variable. Considering the following implementation for local variable assignment, the result looks plausible:
abstract class LocalVariableWriteNode extends ExpressionNode {
  protected final FrameSlot slot;
  public LocalVariableWriteNode(FrameSlot slot) { this.slot = slot; }

  @Specialization
  public Object writeGeneric(VirtualFrame frame, Object expValue) {
    ensureObjectKind();
    frame.setObject(slot, expValue);
    return expValue;
  }
// ...
Currently, our local variables only consider objects. Unfortunately, Graal cannot automatically remove the boxing operations for us, so, we need to optimize this manually.
Type-Specialization of Access to Local Variables
To avoid the boxing, we want to store primitive values directly into the frame objects. We’ll do this by providing additional specializations for the LocalVariableWriteNode and LocalVariableReadNode classes.
Let’s start with writing to variables. We need to add new specializations to the class. Depending on the type of the value that the expr returns, we can use the frame’s type-specific setters:
@NodeChild(value = "expr", type = ExpressionNode.class)
abstract class LocalVariableWriteNode extends ExpressionNode {
  protected final FrameSlot slot;
  public LocalVariableWriteNode(FrameSlot slot) { this.slot = slot; }

  @Specialization(guards = "isIntKind()")
  public int writeInt(VirtualFrame frame, int expValue) {
    frame.setInt(slot, expValue);
    return expValue;
  }

  @Specialization(guards = "isDoubleKind()")
  public double writeDouble(VirtualFrame frame, double expValue) {
    frame.setDouble(slot, expValue);
    return expValue;
  }

  @Specialization(contains = {"writeInt", "writeDouble"})
  public Object writeGeneric(VirtualFrame frame, Object expValue) {
    slot.setKind(FrameSlotKind.Object);
    frame.setObject(slot, expValue);
    return expValue;
  }

  protected final boolean isIntKind() {
    if (slot.getKind() == FrameSlotKind.Int) { return true; }
    if (slot.getKind() == FrameSlotKind.Illegal) {
      slot.setKind(FrameSlotKind.Int);
      return true;
    }
    return false;
  }

  protected final boolean isDoubleKind() {
    if (slot.getKind() == FrameSlotKind.Double) { return true; }
    if (slot.getKind() == FrameSlotKind.Illegal) {
      slot.setKind(FrameSlotKind.Double);
      return true;
    }
    return false;
  }
}
We added two new specializations for writing int and double values to the frame. The specialization are based on the implicit check of the result type of the expValue evaluation, which is implied by the method signatures, as well as the defined guards. Since other AST nodes can cause the type of a variable to change, we need to guard a specialization based on the recorded type in the frame slot. Generally, the idea is that we can use a specialization if the slot has either the right type or is not yet initialized. The slot is uninitialized if its kind is Illegal.
Since we now have three different specializations, we need to think about their relation at runtime. By designing the guard so that it fails if unexpected type is found, we make sure that we go to the most general case writeGeneric. This avoids changing back and forth between specialization, which would prevent compilation. Furthermore, we tell the writeGeneric specialization that it contains the two more specific ones. This allows the DSL to generate the right code, so that it really uses only the writeGeneric version and remove previously used specializations to avoid runtime overhead.
The read node is a little simpler:
abstract class LocalVariableReadNode extends ExpressionNode {
  protected final FrameSlot slot;

  public LocalVariableReadNode(FrameSlot slot) { this.slot = slot; }

  @Specialization(guards = "isUninitialized()")
  public Object doNull() { return null; }

  @Specialization(guards = "isInitialized()",
                  rewriteOn = {FrameSlotTypeException.class})
  public int doInt(VirtualFrame frame) throws FrameSlotTypeException {
    return frame.getInt(slot);
  }

  @Specialization(guards = "isInitialized()",
                  rewriteOn = {FrameSlotTypeException.class})
  public double doDouble(VirtualFrame frame) throws FrameSlotTypeException {
    return frame.getDouble(slot);
  }

  @Specialization(guards = "isInitialized()")
  public Object doObject(final VirtualFrame frame) {
    return frame.getValue(slot);
  }

  protected boolean isInitialized() {
    return slot.getKind() != FrameSlotKind.Illegal;
  }

  protected boolean isUninitialized() {
    return slot.getKind() == FrameSlotKind.Illegal;
  }
}
The first specialization uses the slot kind to specialize for the case that a read is done on a variable that has not yet been assigned a value, thus, it returns null. The remaining three specializations are for the int, double, or finally the generic Object case. In the interpreter this means, we first try to read from a slot as int, if that fails, we catch the FrameSlotTypeException and go to the next specialization. In this case, this is the doDouble specialization. If that one fails as well, we go to the last specialization that will always succeed by reading a boxed object.
Measuring the Results
With this optimization in place, let’s see what it gives. We use the same details for execution as earlier and get the following results:
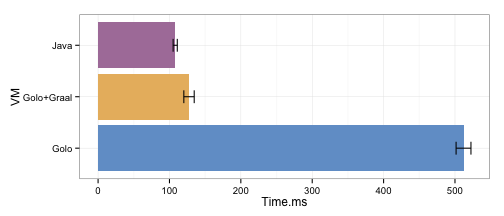
This time around, Golo+Graal is about as fast as Java. It is roughly 18% slower than Java, but about 4x faster than Golo with its bytecode-based backend on top of the Hotspot JVM. With a little bit more optimizing, we would probably be able to squeeze a little bit more out of Golo+Graal, but, let’s call it fast enough for now.
Summary
In this post, we discussed how Graal compiles our interpreter, how to use IGV to get a better understanding of what is going on, and how we can optimize the access to local variables to avoid excessive overhead because of boxing. With the optimization, we reached Java’s speed within 20% and are 4x faster than Golo was before. Overall, a pretty nice result.
However, we had to built a new interpreter from scratch, which took quite a bit of time and code. And, the implementation is nowhere near completion. To execute Golo programs, we would still need to implement a large number of things. For instance, how to support its dynamic objects based on the Truffle object model, how to use the @Cached support of the DSL for inline caches, perhaps how to optimize tail-calls to encourage a more functional programming style, etc. Plenty of things left to discuss. But for now, this post completes this series. I hope you found it useful.
If you start with your on project, drop by the Graal mailing list or check the archives. We will try to answer your questions. Truffle looks somewhat simple in the beginning, but my experience is that it takes quite a bit to get used to thinking in the way the interpreter and compilation interact to get great results.
Truffle Concepts
To close off this post, a brief list of the introduced concepts:
@TruffleBoundaryasks Graal to stop inlining here during the partial evaluation pass. This is necessary for instance for recursive code, when the termination condition is not based on a compile-time constant.- Guards encode conditions for when a specialization is applicable.
containsdenotes specializations that are subsumed by a more generic specialization.@Cachedis an annotation to support custom inline caches in specializations.
Acknowledgements
I’d like to thank Julien Ponge for his comments on drafts of this tutorial and his help with the technical details of Golo. And thanks to Gilles Duboscq for spotting typos.

“Add Graal JIT Compilation to Your JVM Language in 5 Easy Steps” by Stefan Marr is licensed under a Creative Commons Attribution-NonCommercial-ShareAlike 4.0 International License.
Permissions beyond the scope of this license are available on request.