 I head the
Is This Noise, or Does This Mean Something? #benchmarking
Do my performance measurements allow me to conclude anything at all?
For the work on various research languages (SOMns, SOM, TruffleSOM …), I have been using continuous performance tracking for the better part of the last decade.
One would hope that I would know what I am doing…
Since about half a year, I am using ReBenchDB to track performance (before I used Codespeed), and use the same statistical tools, that I am using for academic research papers. While ReBenchDB is of great help, and built for exactly what I want to do, it made me question more strongly than before whether I can even trust these benchmark results.
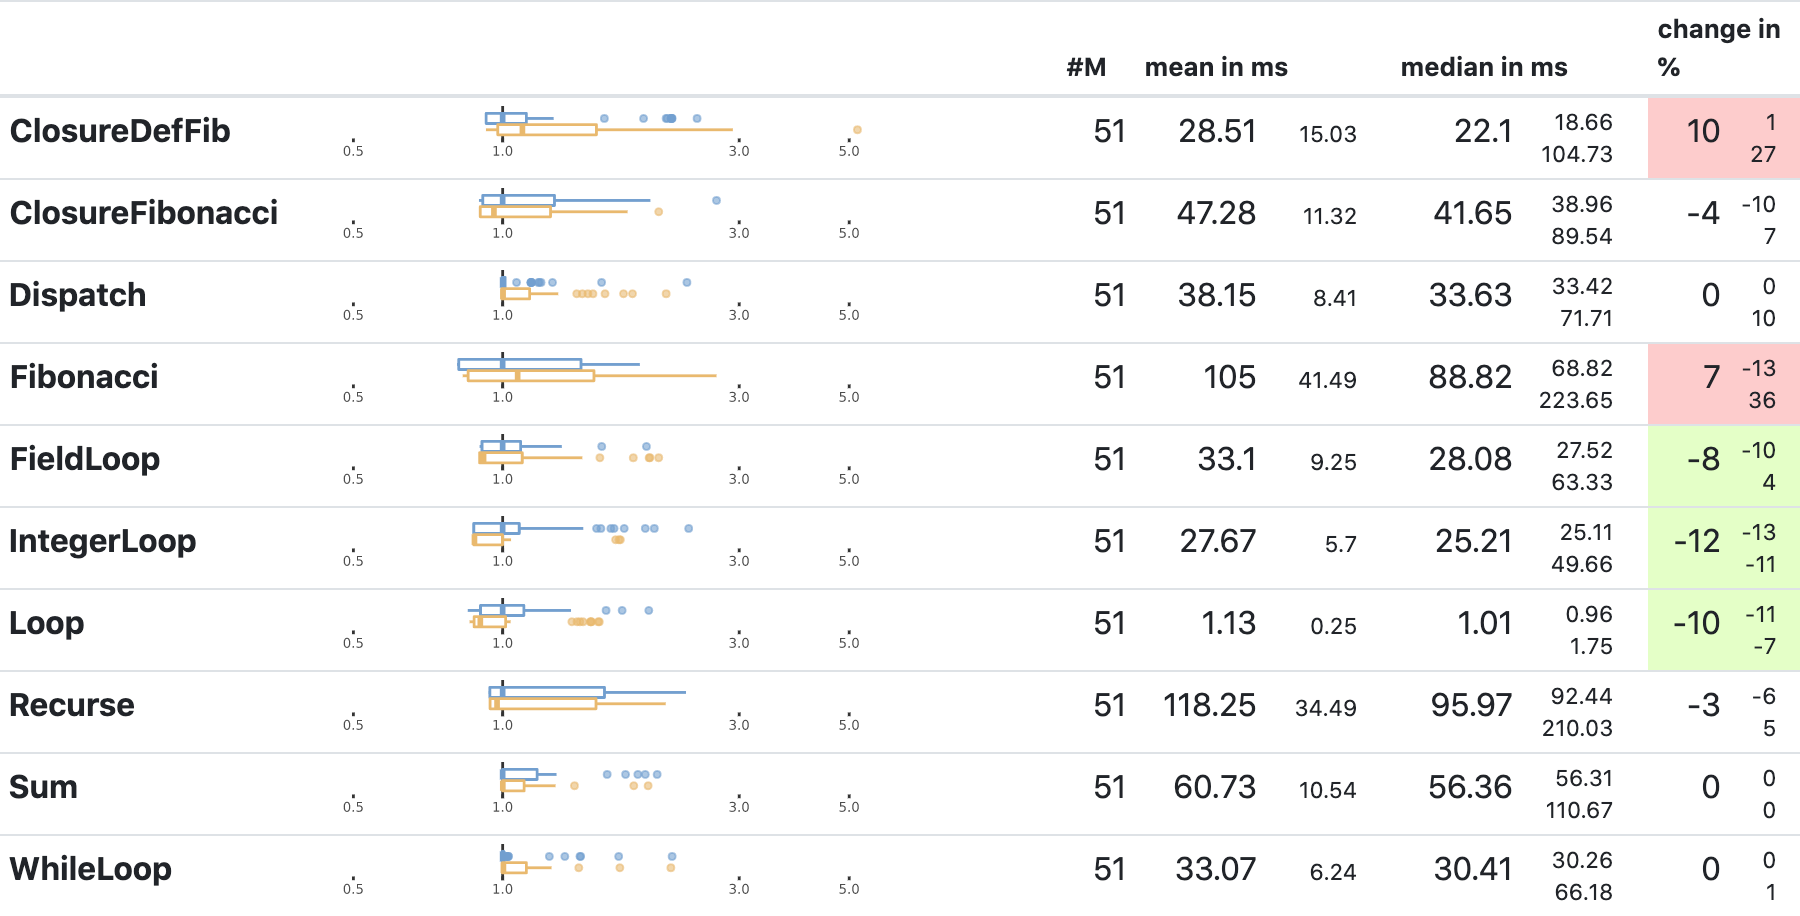
The screenshot shows a table with the results of an experiment for which I would like to know whether it changes the performance of my language implementation. I picked a section from the full report showing microbenchmarks, since I would expect them to be the simplest to explain, and for this particular experiment, I wouldn’t expect any changes.
On first inspection, the results seem however mixed. We got two benchmarks marked as red and three as green, which may indicate slowdowns and speedups. Though, a closer look at the boxplots indicates that we can’t really draw any strong conclusions. The boxes pretty much overlap, and my experience tells me that this may as well just be noise. I have seen similar ups and downs rather frequently on these benchmarks.
This means, I can’t tell with confidence whether the change I tried to benchmark has any kind of positive or negative impact on performance. Though, I am somewhat sure that nothing went terribly wrong. I guess that’s at least something.
One option may perhaps be to let the benchmarks run for longer. Currently, it takes about 40min for the benchmark setup to run. If the reliability of the results could be increased, perhaps running the benchmarks for an hour may still be good enough. Much longer run times will just mean that benchmarking will be ignored, so, there’s really an upper limit on how long things can take. Another option might be adding more benchmarking machines, though, currently, there’s no budget for that either.
So, what would it take to improve the reliability of my benchmarks and get numbers that I can trust more readily?
Gathering More Data to Understand What’s Going On
The benchmarking setup I am using relies on ReBench. This means, in the ideal case, I can simply ask ReBench to execute every benchmark for 3000 iterations and repeat this 30. Since I know that compilation triggers after 1000 iterations, this should give us fully warmed up execution. Having everything executed 30 times, i.e., using 30 invocations should make sure that any variation across different invocations can also be determined reliably.
This should be all we need to change about the setup:
rebench --invocation=30 --iteration=3000 rebench.conf
About 7.5 days later, I got the data I wanted.
Not something that’s practical for everyday development…
Get a Bit of an Overview of All the Data
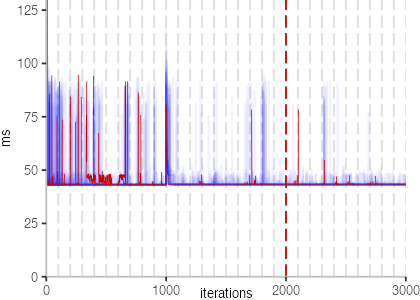
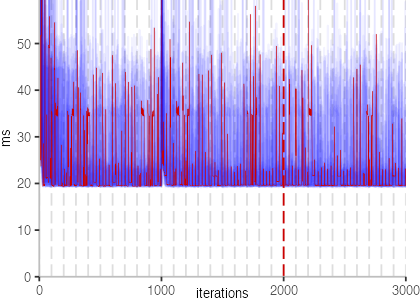
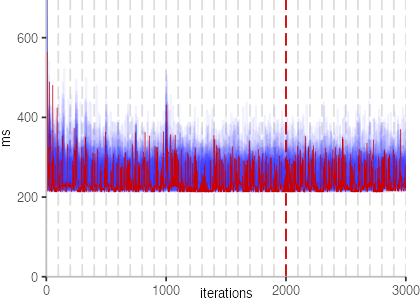
Having the data, let’s try to get an impression of the overall situation. A line chart that shows the iterations on the x-axis and the run time of an iteration in milliseconds on the y-axis should do the job.
Though, we got 30 invocations for every benchmark. To see how these invocations differ, I’ll include all but make the lines transparent. This should allow us to see differences in behavior.
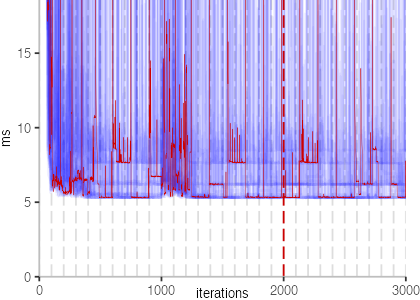
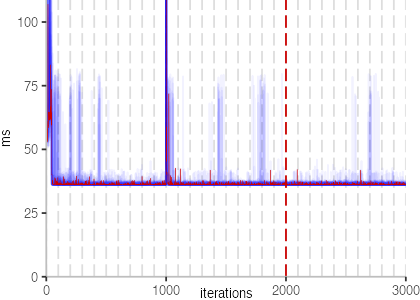
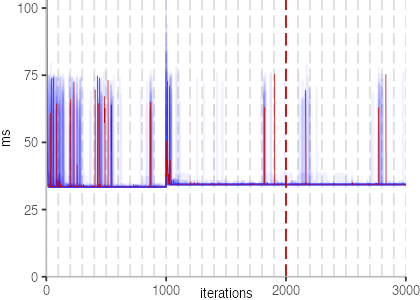
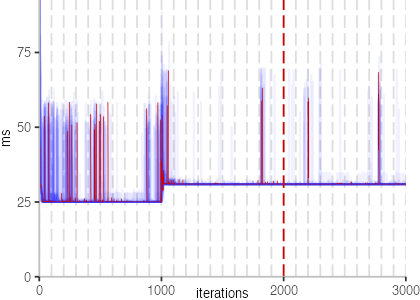
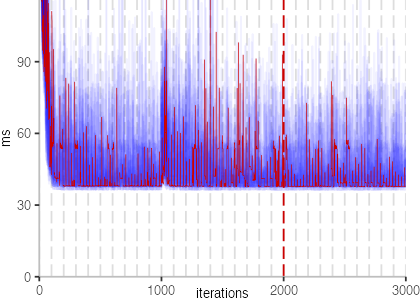
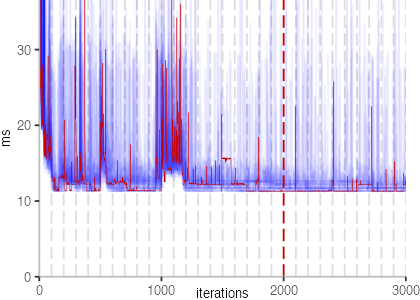
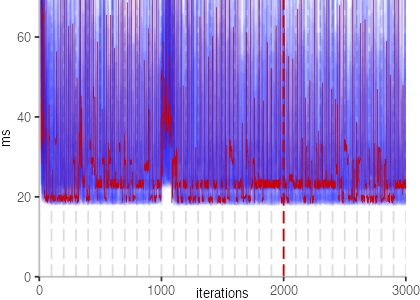
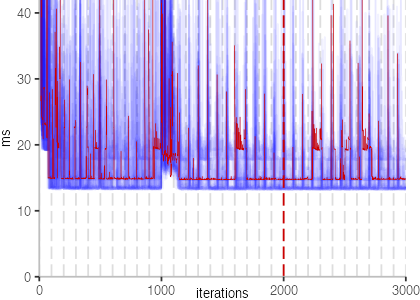
The first plot below shows the IntegerLoop benchmark:
public benchmark = ( | bounds a |
  bounds:: 20000.
  bounds negated to: bounds by: 1 do: [:value | a:: value - value].
  ^ a
)
The above code is a loop from -20000 to 20000 that sets the variable a
to the result of subtracting the current loop index from itself.
It’s a classic microbenchmark
and I wouldn’t expect too many complications from it.
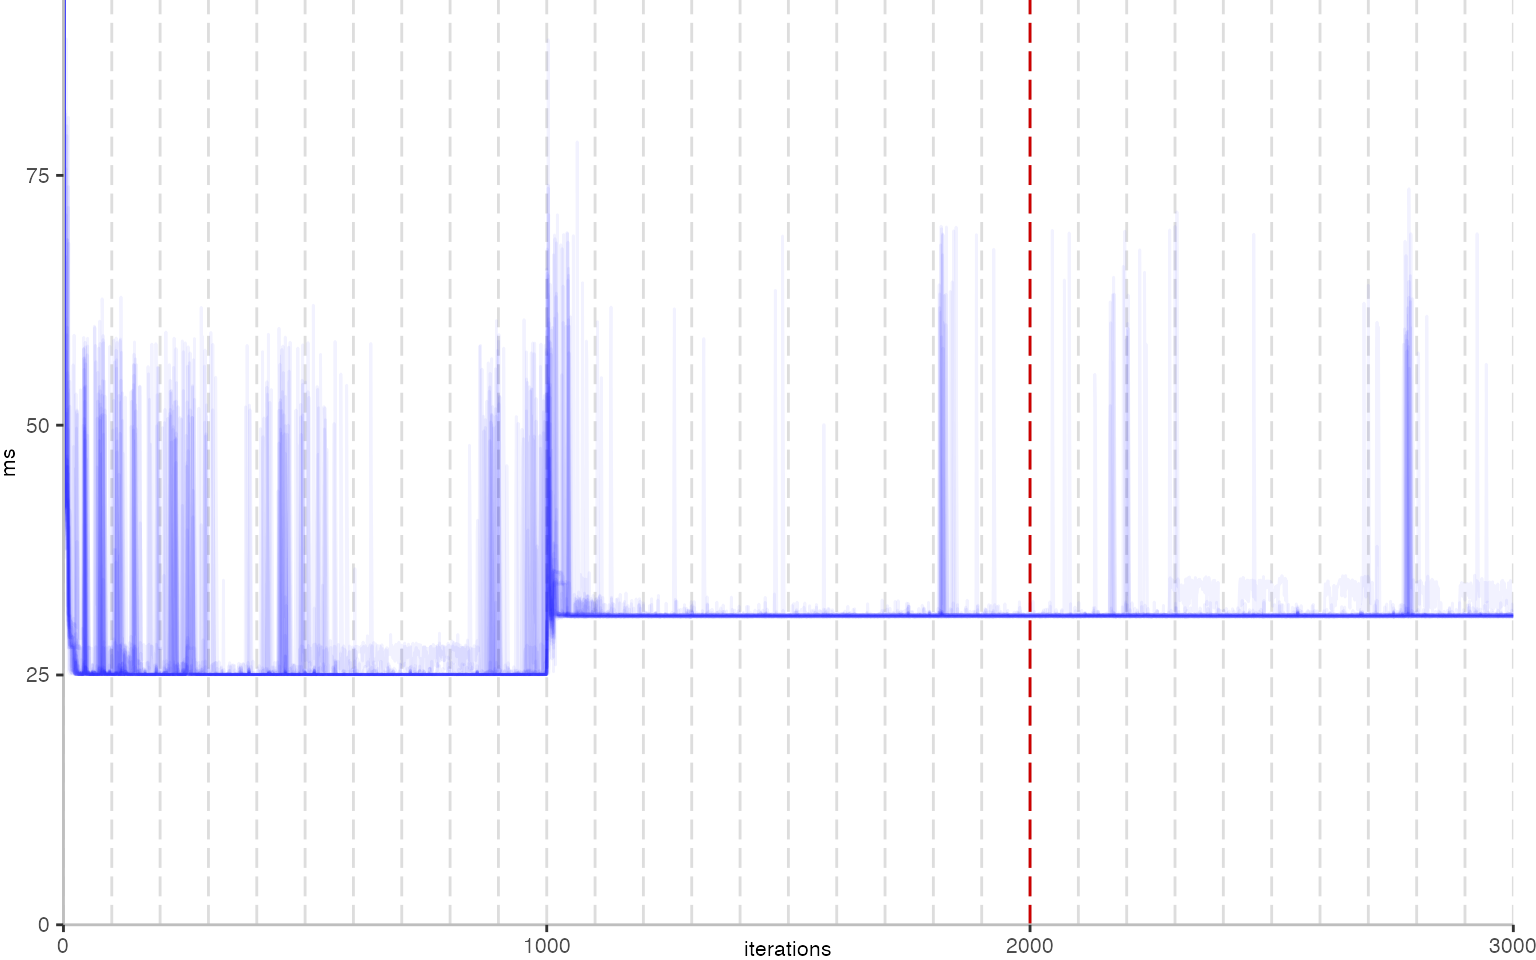
Though, the plot shows a few interesting bits. First note that there is a
dark blue line coming down and then settling at about 25ms.
At iteration 1000, we can see a clear spike. At this point, the
benchmark harness itself crossed the compilation threshold and got compiled.
Before, only our benchmark method from above was compiled,
since it was executed in an additional loop in the harness.
Unfortunately, by compiling the harness as well, performance seems to
decrease a bit to about 30ms, i.e. a 20% increase in run time.
Since compilers rely on heuristics,
these things can happen.
Though, it would be good to look into why it happens here.
But back to the plot itself. We also see light blue spikes, in different shades of blue, and different sizes. These spikes likely correspond to garbage collection or compilation events. Though, overall, the result is pretty stable. Except for the undesirable slowdown, we would hope that all benchmarks look like this, since all thirty invocations would report the same result.
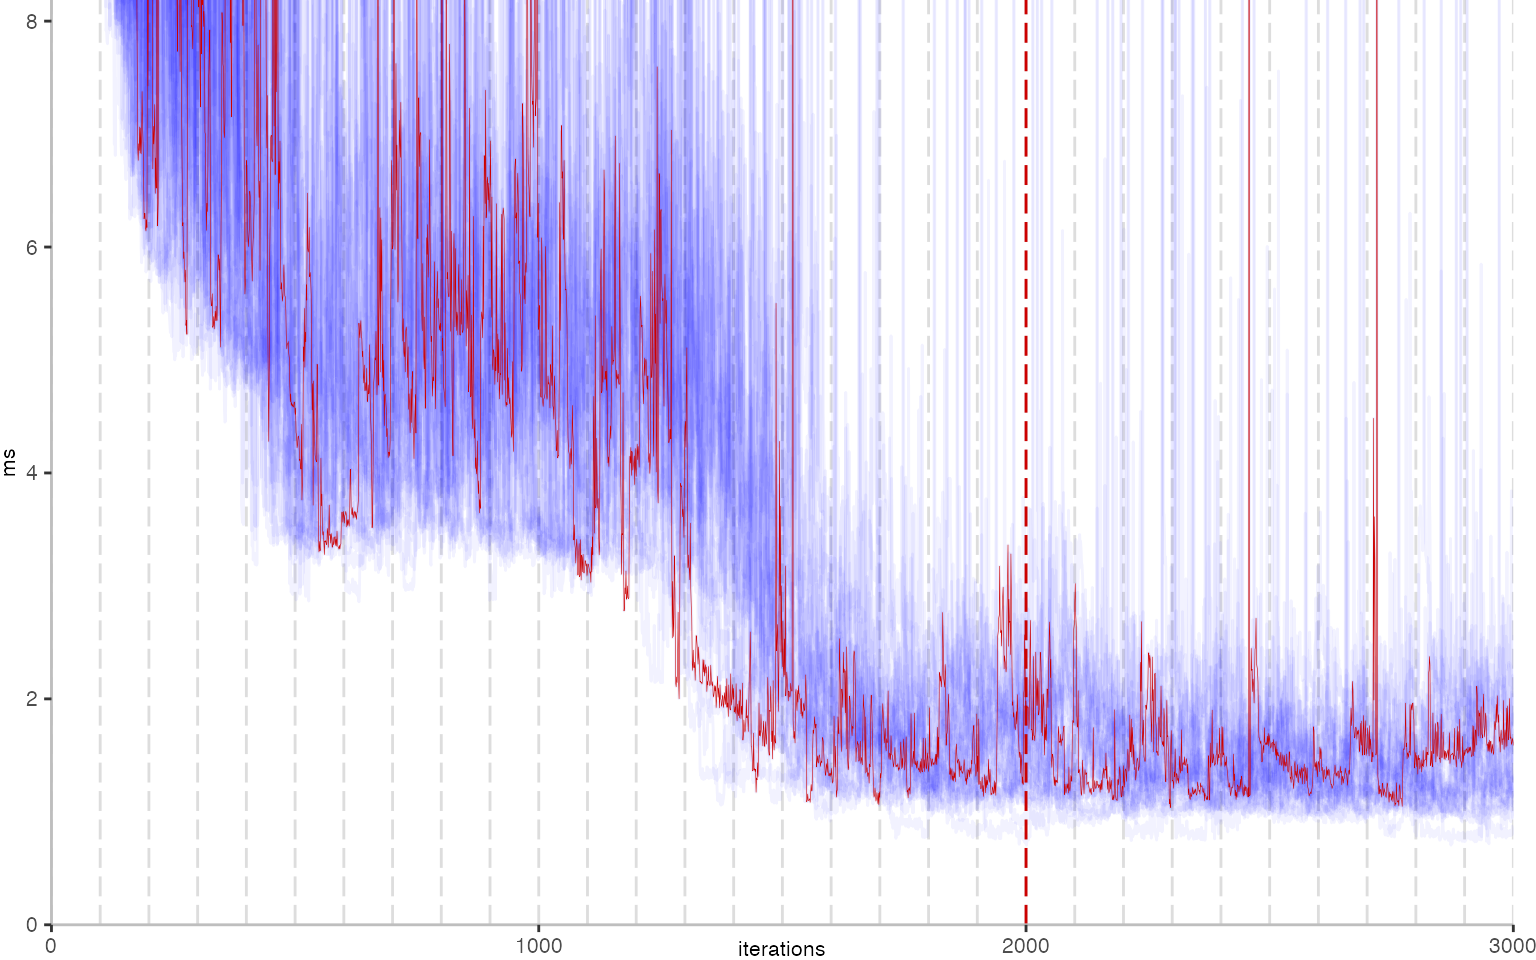
The next plot below shows the Vacation benchmark, which is a simulation of a travel booking system that has been used for instance to benchmark software transactional memory systems. The version used here, relies on threads and locks, even though, we run it only with a single thread.
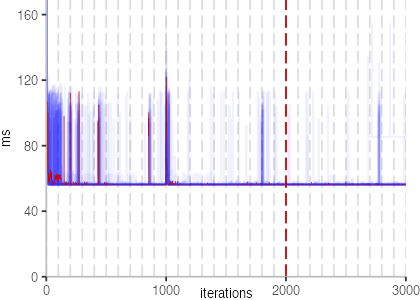
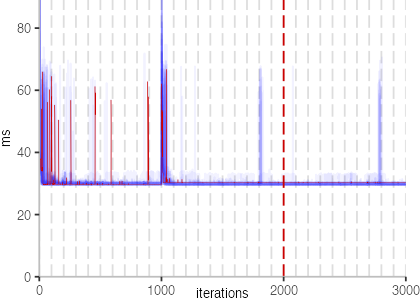
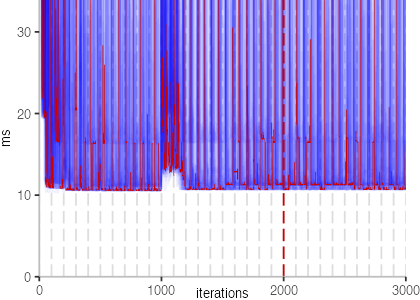
All Iteration Plots
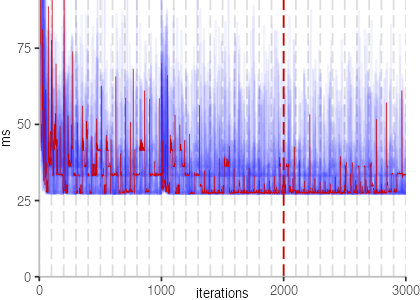
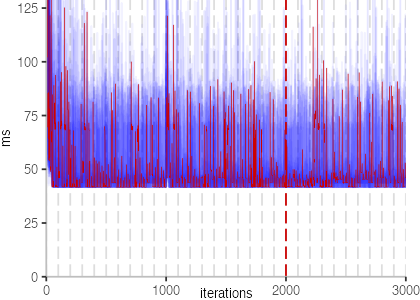
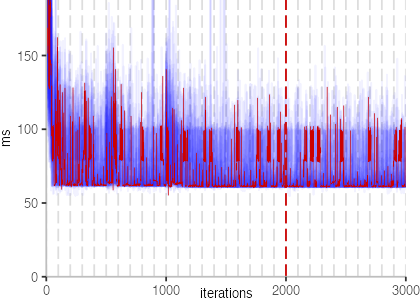
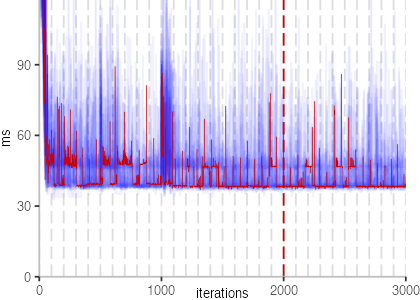
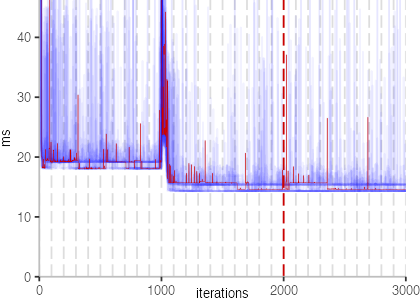
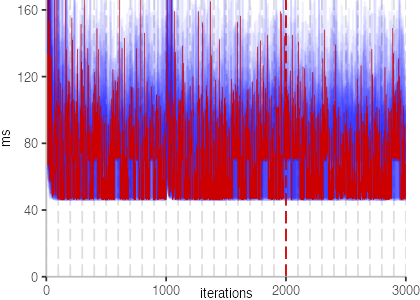
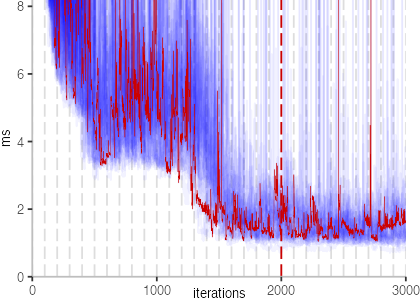
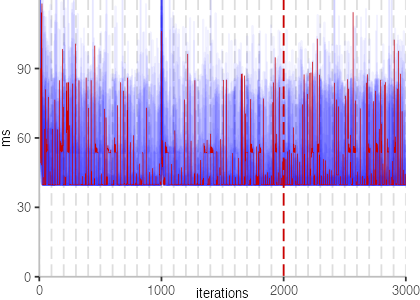

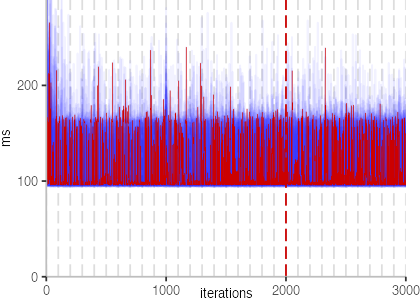
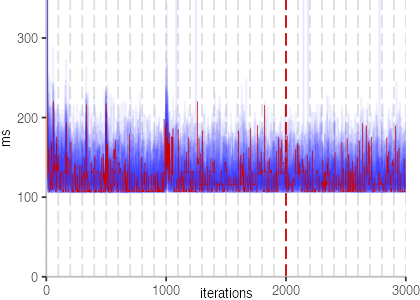
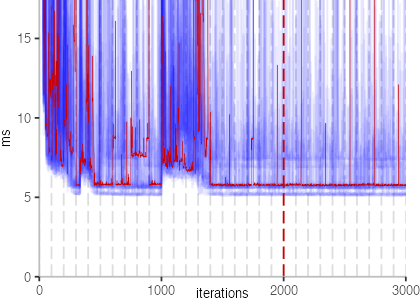
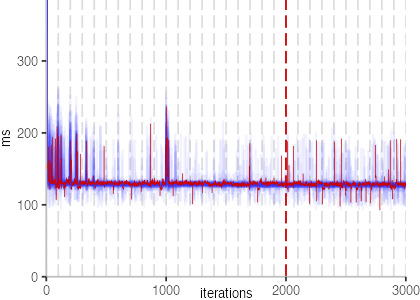
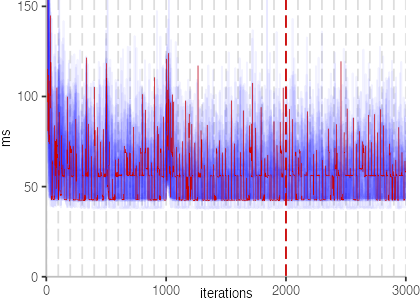
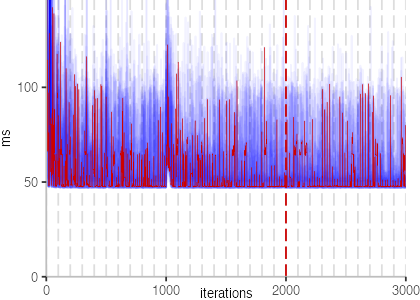
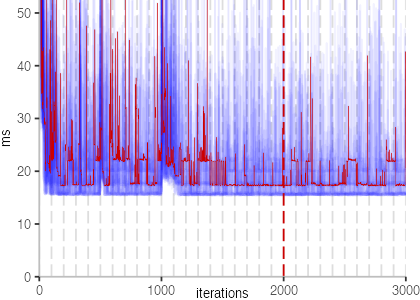

The plot is clearly less nice than the one for IntegerLoop. Only after about a 100 iterations, we reach a point where the measurements fit onto the plot. This shows that the compiler can optimize the benchmark very well, but it takes time to do so. Eventually, the benchmark reaches a run time of under 2ms, which isn’t ideal, since we might simply be measuring noise at this level of performance.
We also see that there is a much larger area that is different shades of blue. Though, there seems to be a blue core, which indicates that there is a somewhat normal-ish distribution of iteration times across our 30 invocations of the benchmark.
Just to emphasize what is visualized, I picked out one invocation, and instead of plotting it in a transparent blue, it’s plotted in red. With it we can see the ups and downs within a single invocation, but the overall trend seems to stabilize.
The plots for all benchmarks are shown in the box on the right.
How Close Can We Get to the “True” Average Performance?
After inspecting our plots, and considering the compilation threshold of 1000 iterations, it seems plausible to define the “true” average for our benchmarks based on the measurements after the 2000th iteration. In the previous plots, you may have noticed the red dashed line at the 2000th iteration. This definition gives us 1000 iterations to calculate the average from. As a somewhat stable average, I’ll use the median for now. Let’s assume for simplicity that this is fine.
Since the time benchmarking takes needs to be practical, I need to to minimize this warmup threshold as well as the number of iterations used to calculate the median, while keeping it within an acceptable range of the “true” median I calculated from the last 1000 iterations.
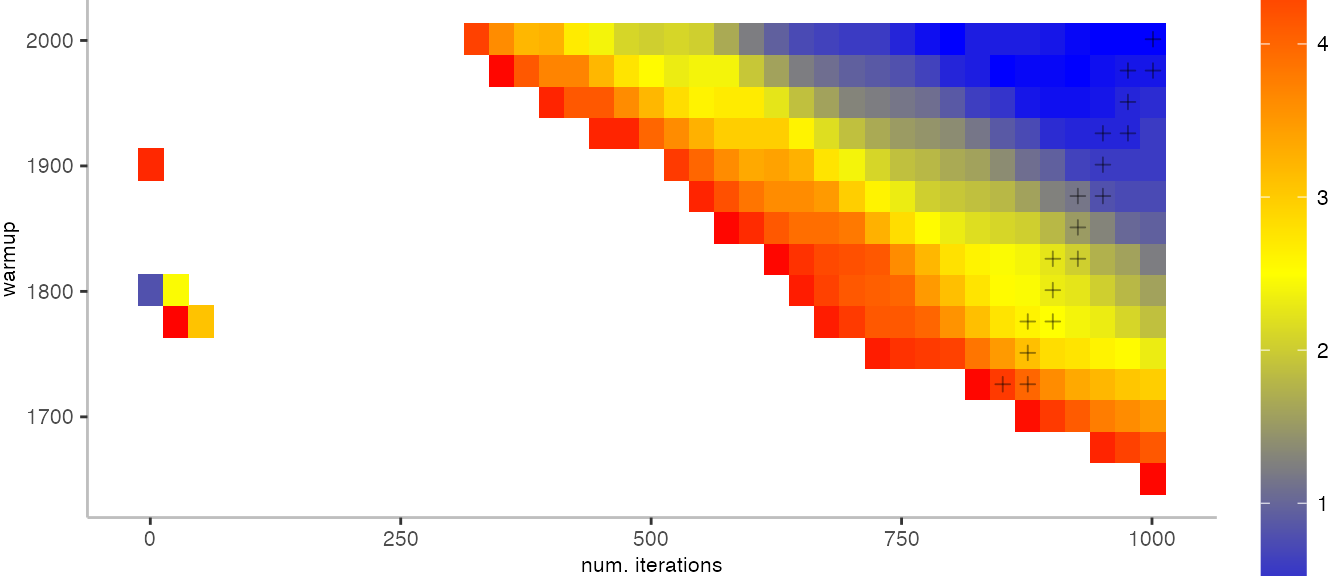
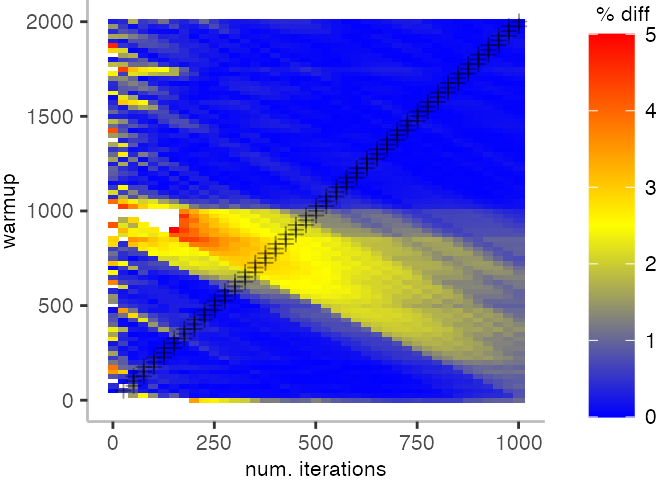
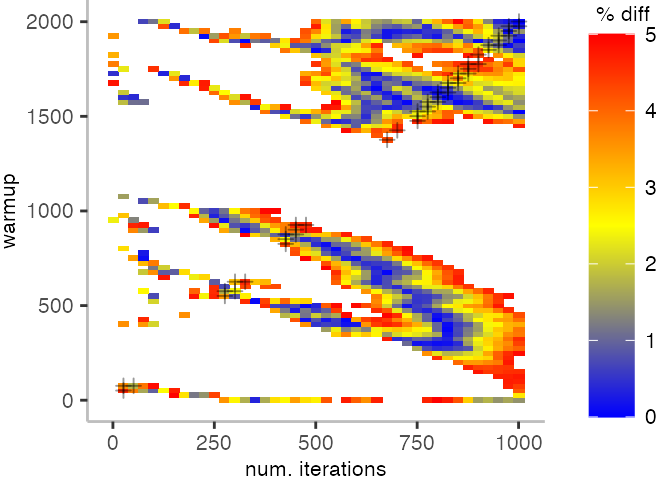
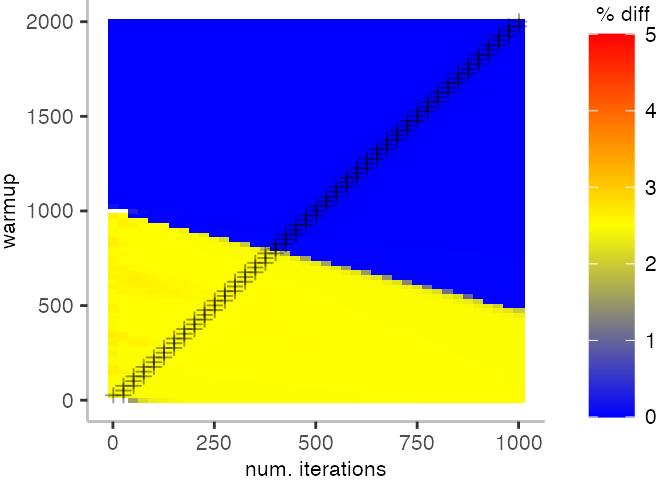
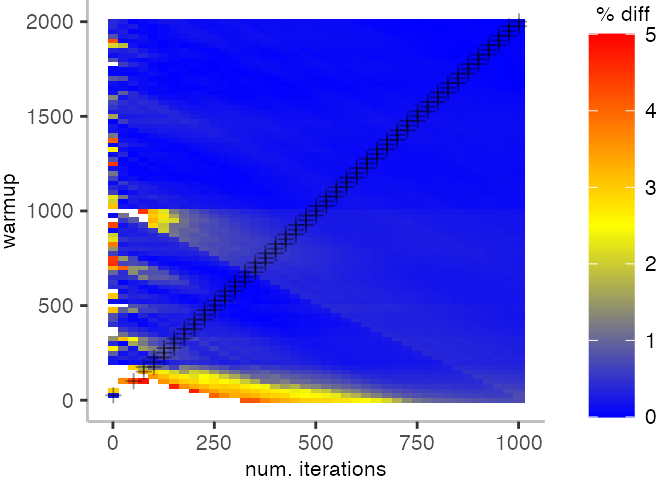
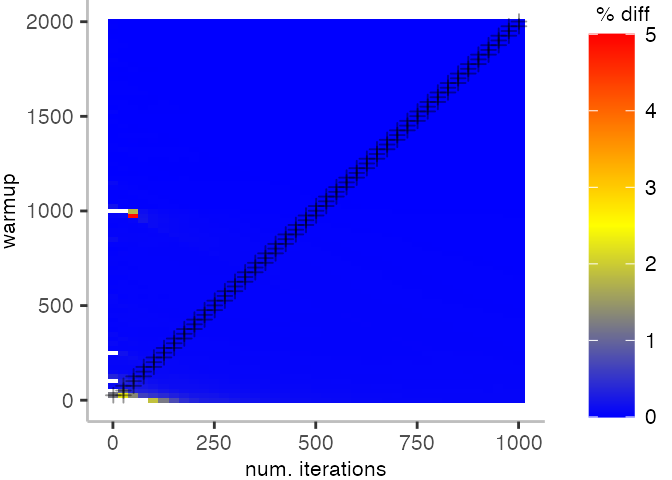
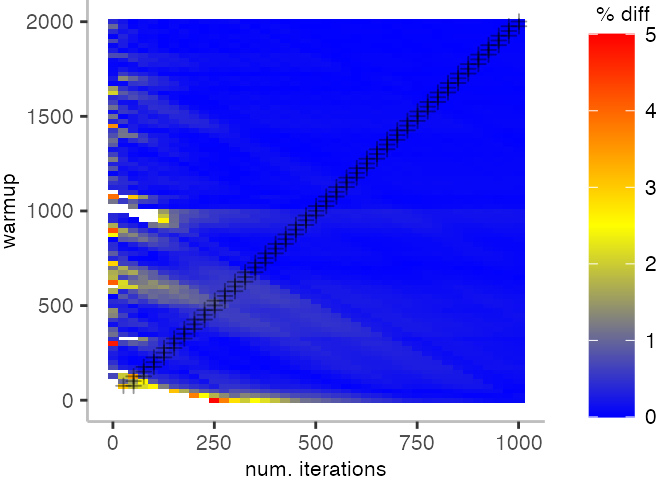
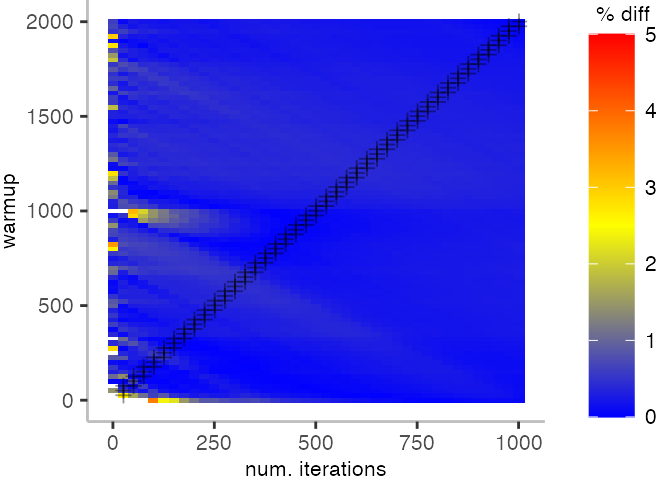
To get a feeling of whether this is workable, I’ll visualize how far off the median is when I take various different warmup thresholds and number of iterations to calculate the average.
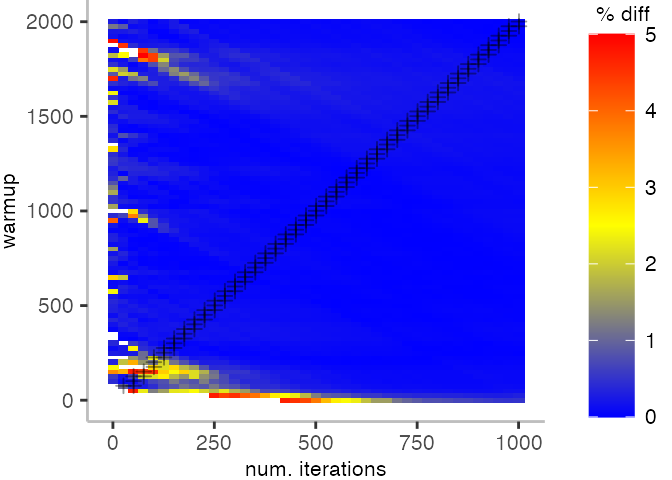
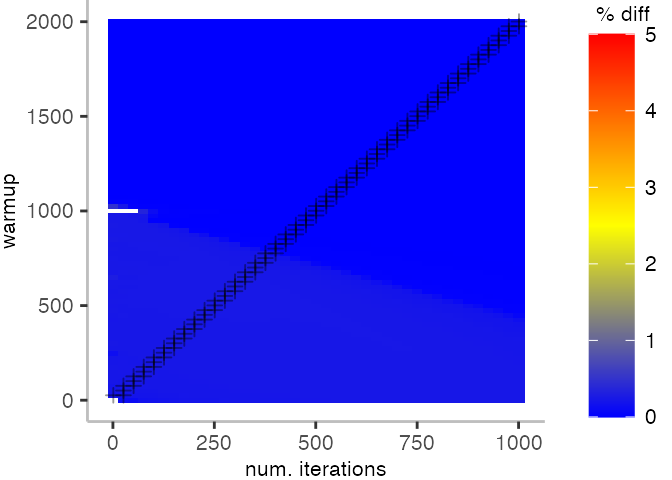
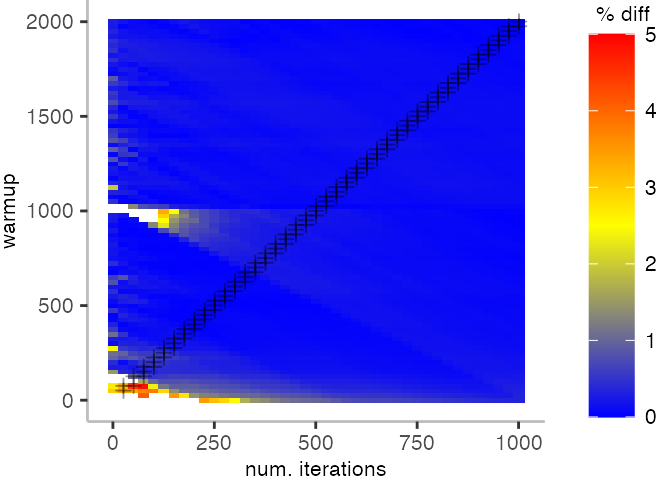
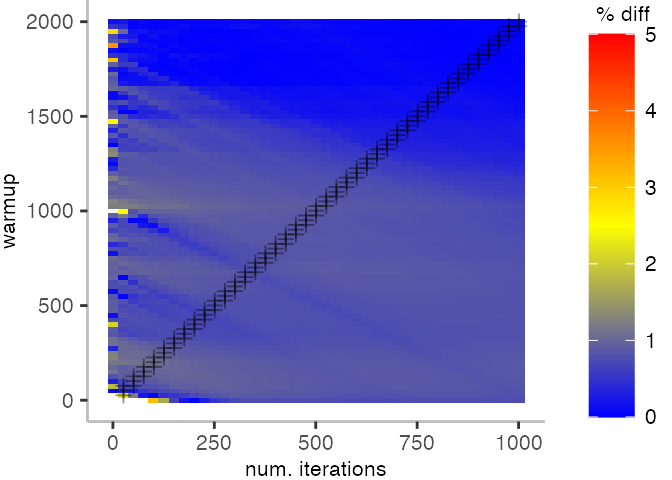
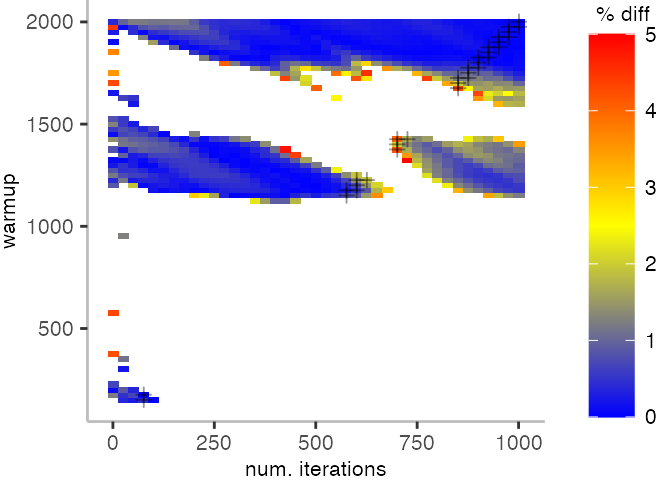
The plot below depicts the difference to the “true” median in percent. A clear blue means that the median calculated from after discarding the warmup iteration on the y-axis and using only the first n iterations (x-axis) is identical to the “true” median. A clear bright red means the median differs by 5%. If no color is given, the median differs by more than 5%.
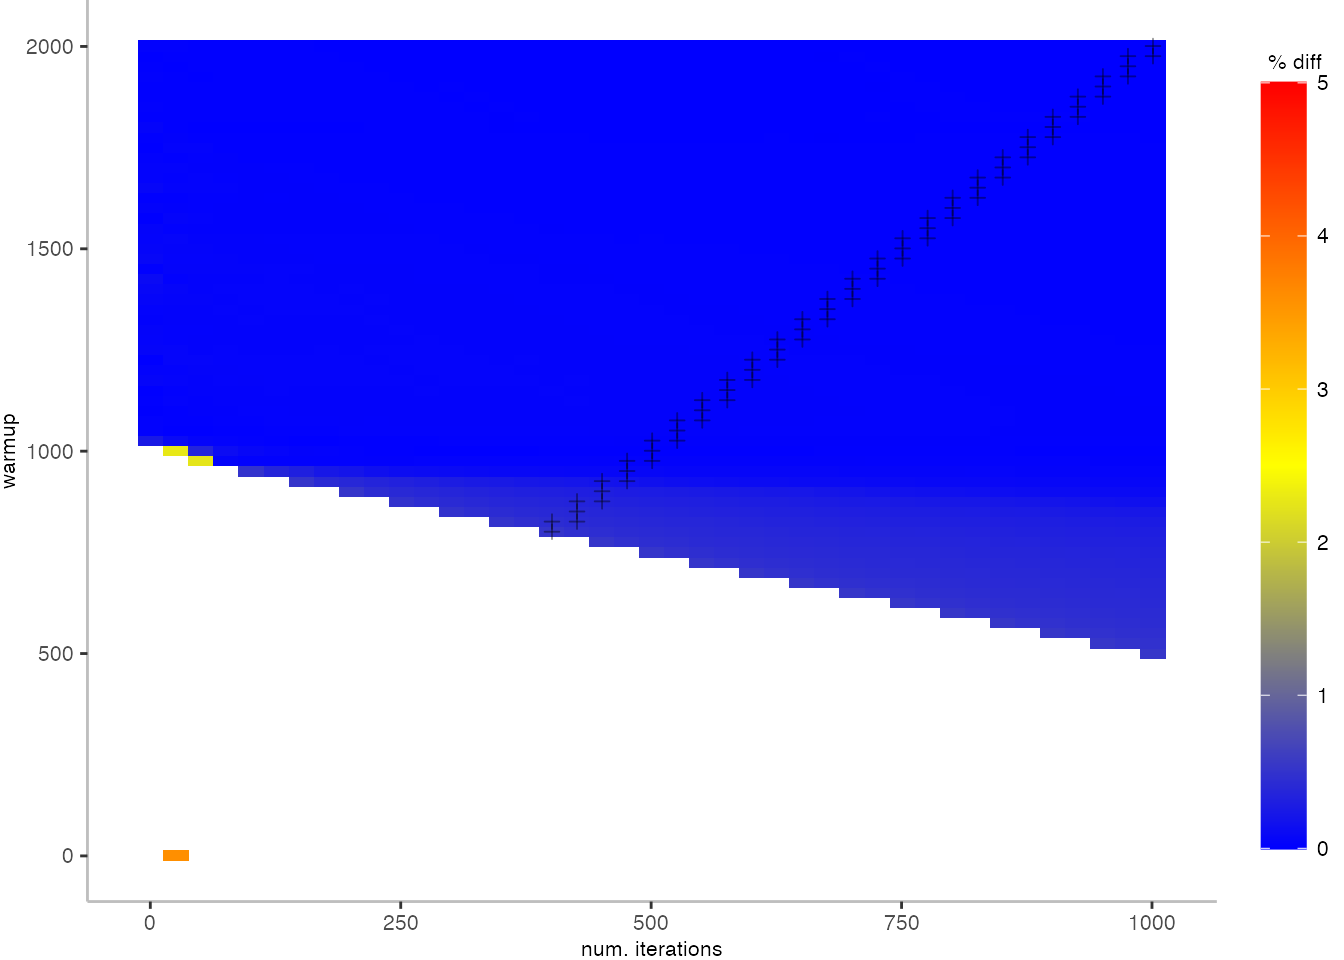
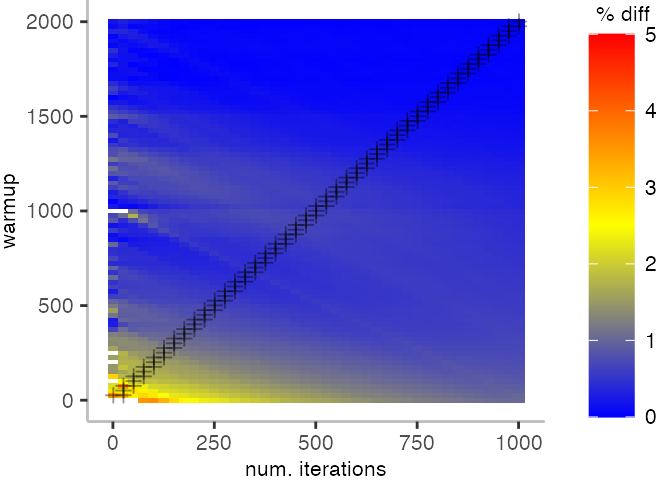
This means, for our IntegerLoop benchmark, we can match the figure easily to our previous figure. Because of how the compilation decided to optimize, we have initially a performance that differs by about 20% from the “true” median and thus, is left white. Around the 1000th iteration, discarding them as warmup, and using only perhaps 100 iterations for the mean, we see some yellow, which means the mean is off by 2.5%. Below 1000 iterations of warmup, but with more than a 100 or so iterations, we see a darker shade of blue, indicating perhaps 1% difference from the mean. The rest is clear blue, indicating that which ever configuration of warmup and iterations we chose would match the true median.
All Warmup/Iteration Plots
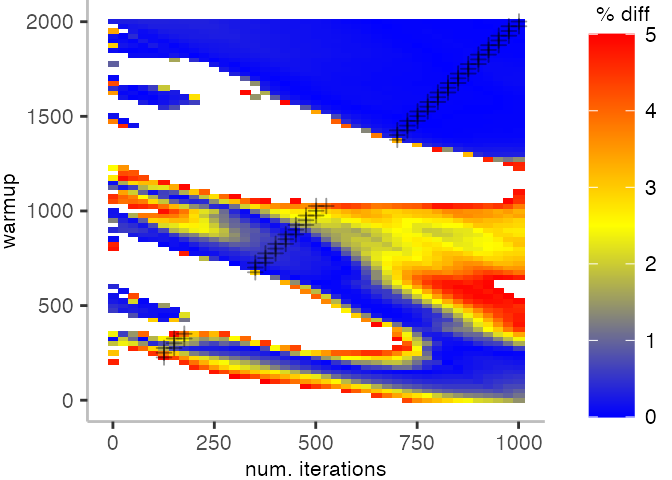
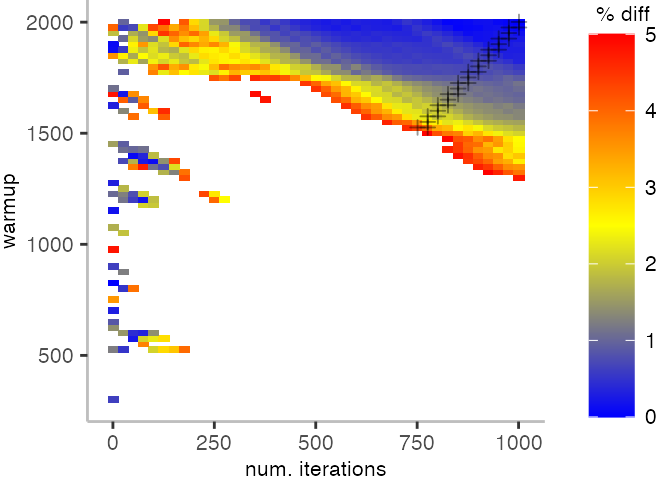
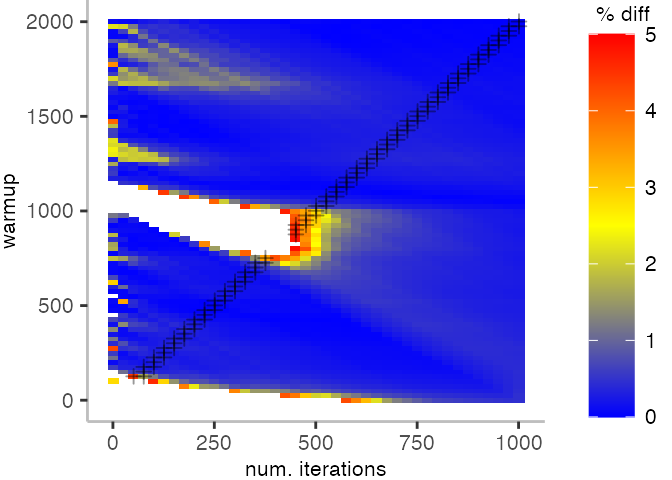
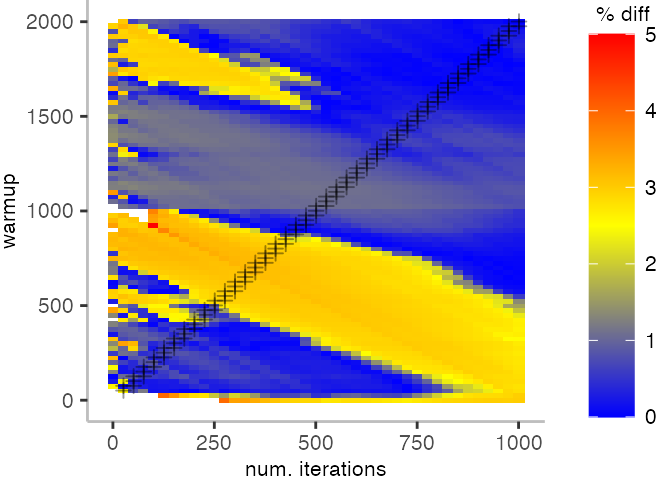
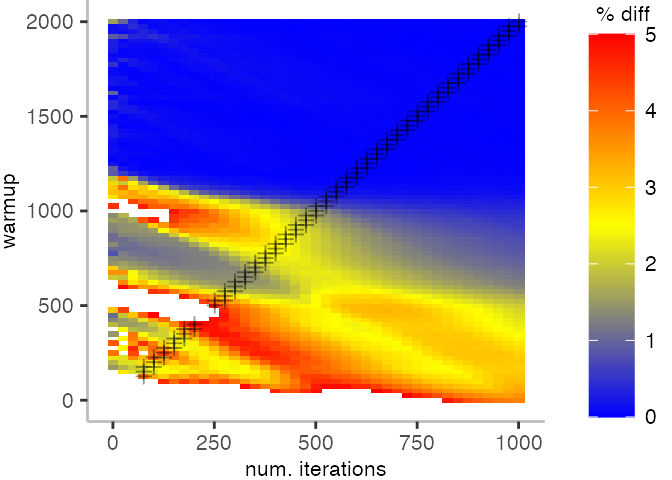
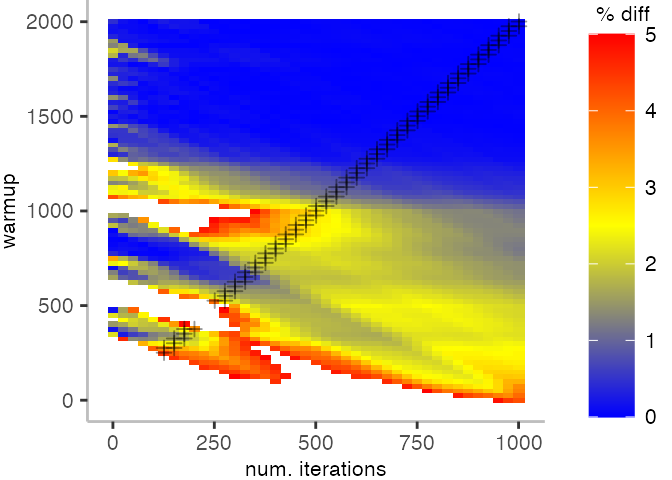


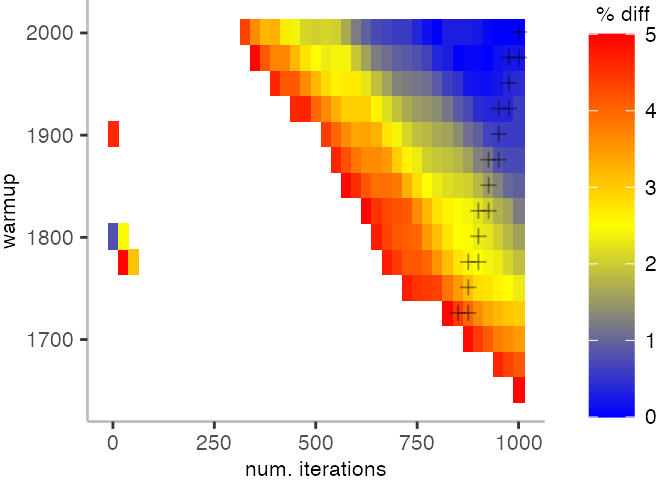
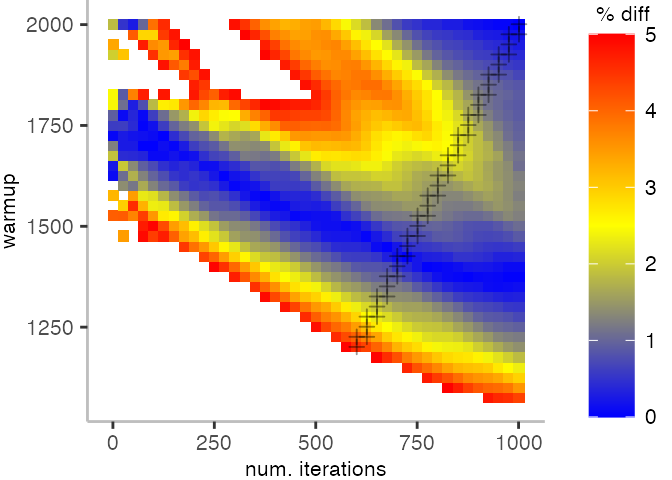

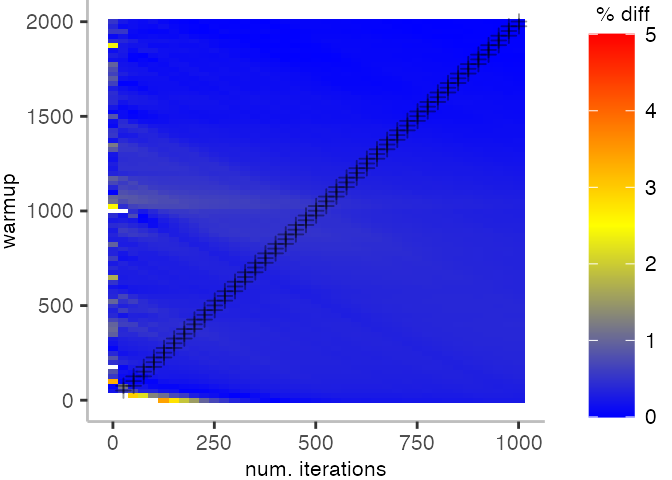
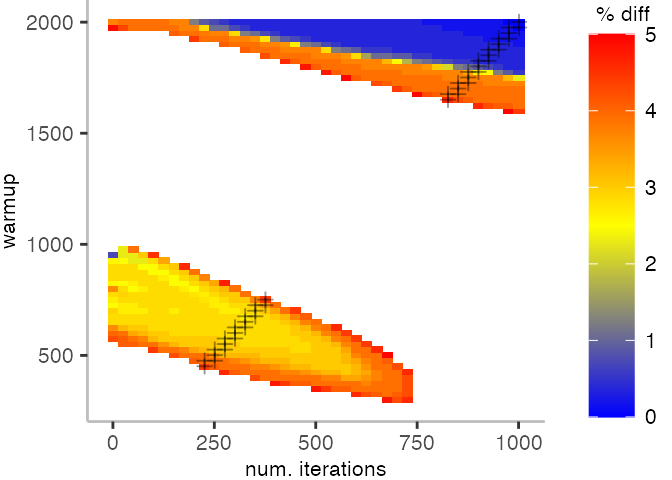

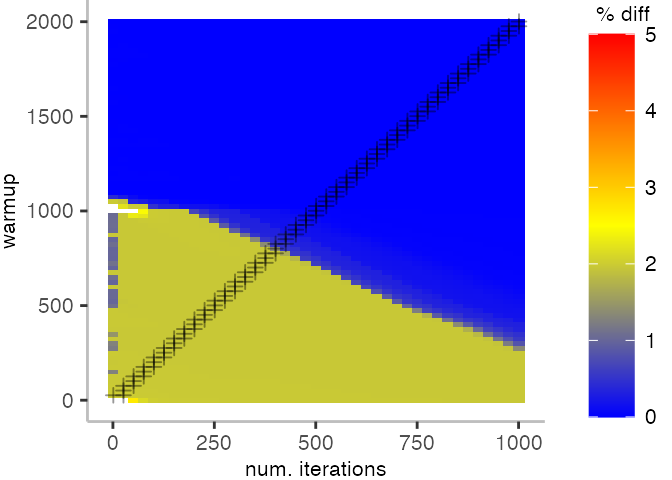
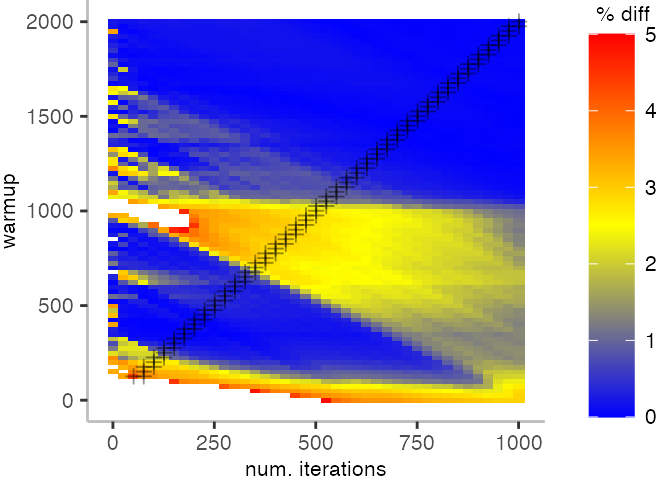
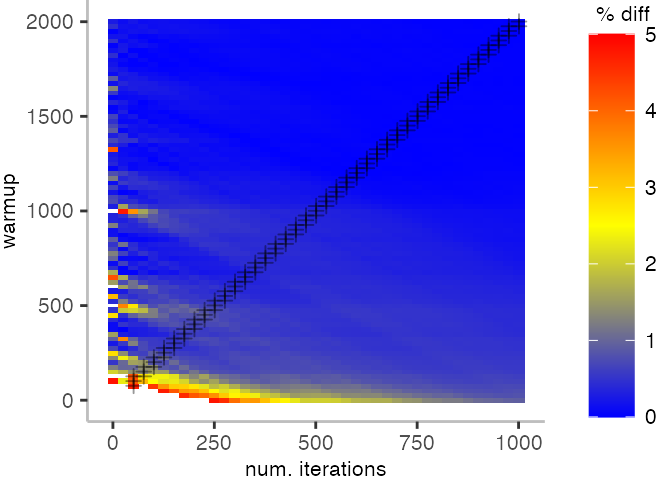
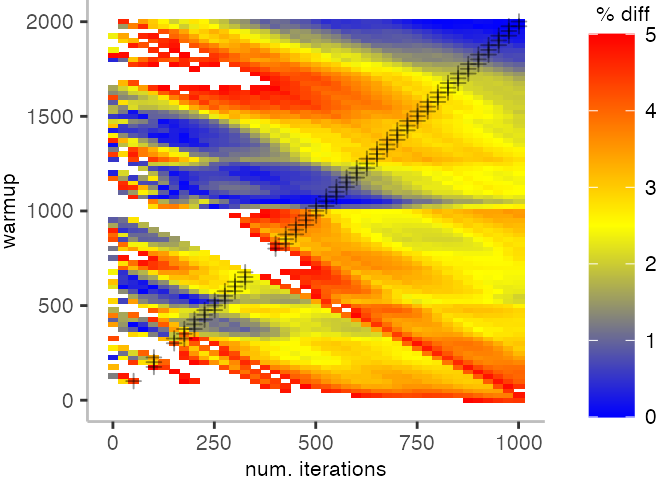
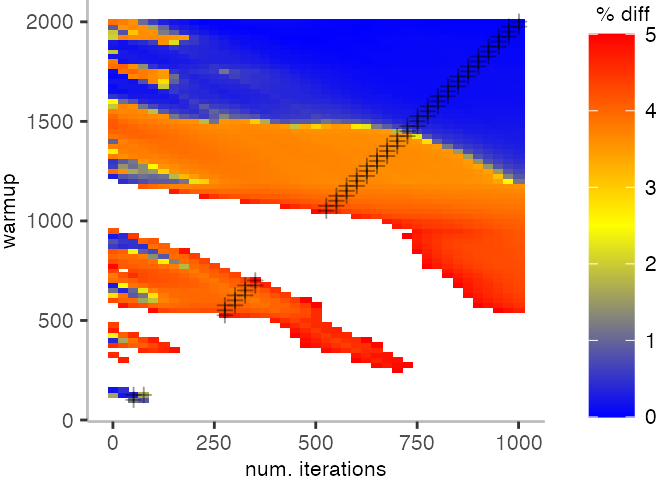
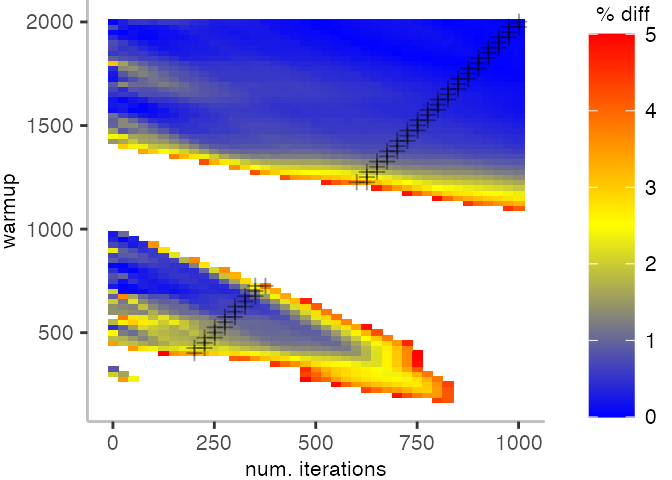
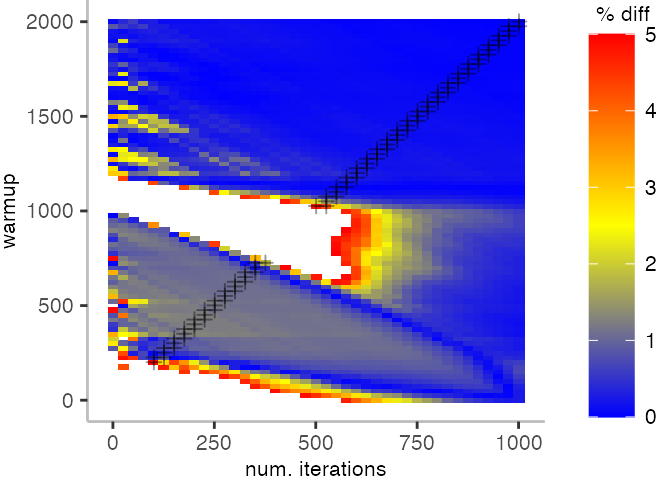
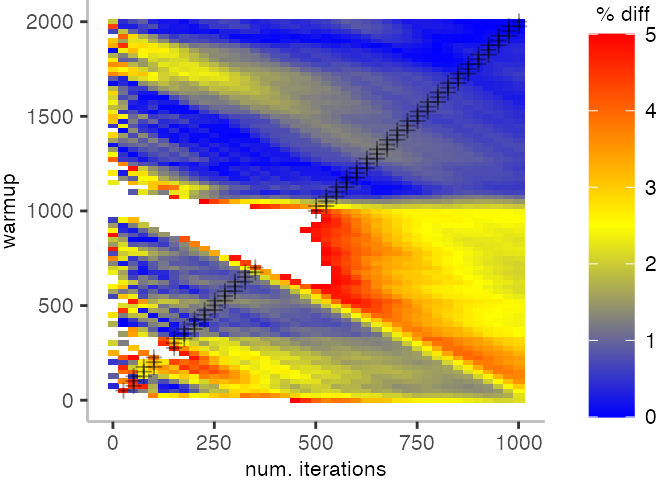
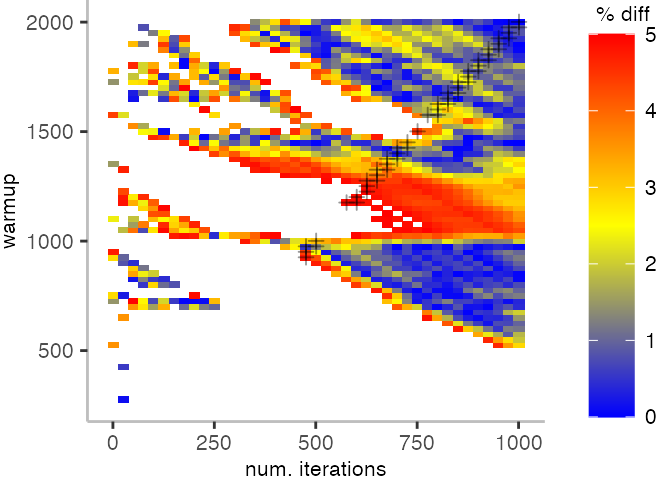
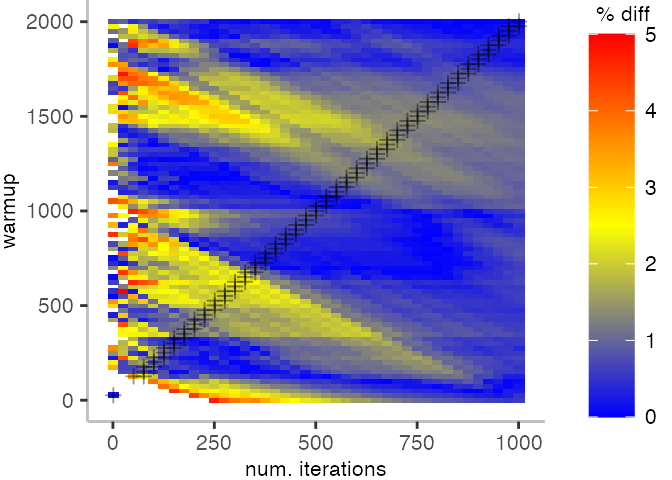
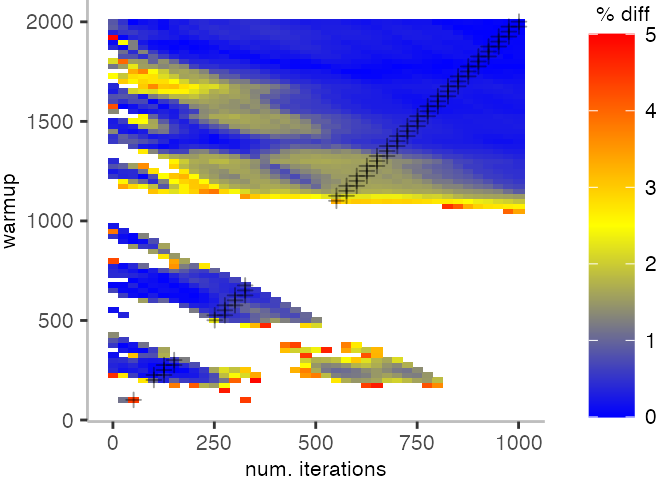
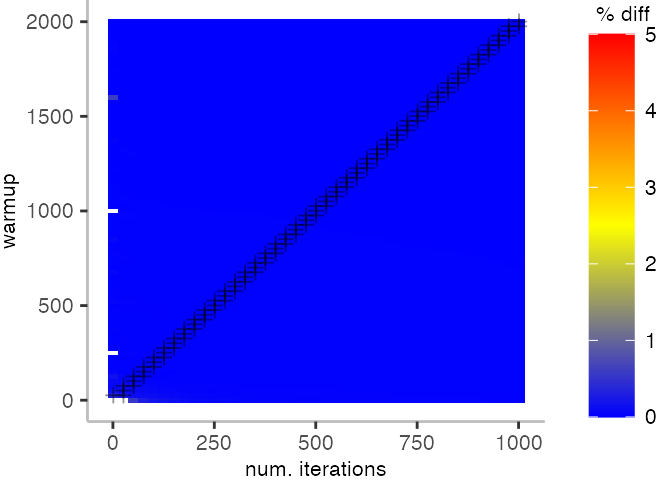
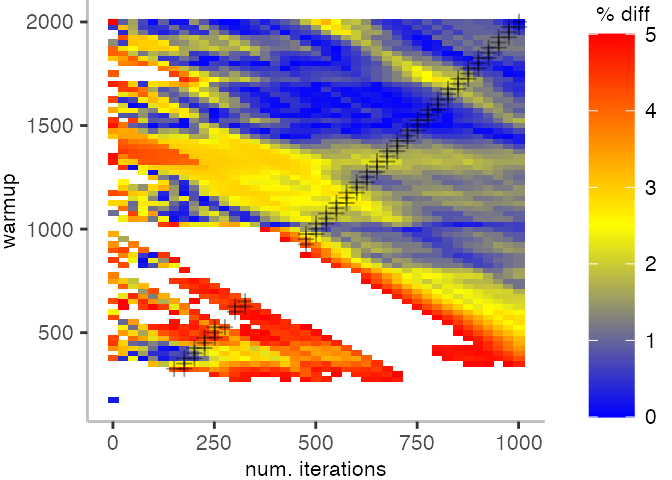
For the Vacation benchmark, the plot is more interesting. For the most parts, we are far off the “true” median. Though, then with increasing number of warmup and used iterations, we get close to it. This establishes a diagonal where the values become gradually more accurate.
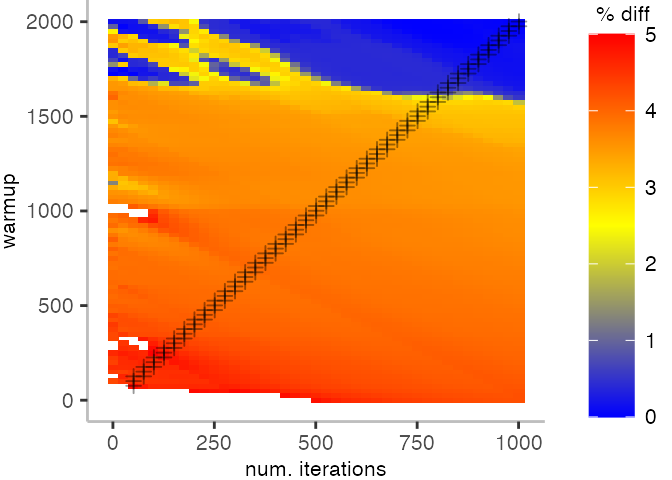
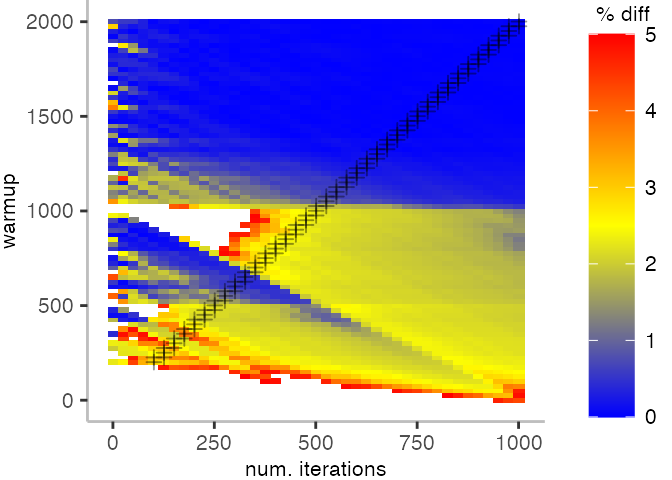
Looking at these plots for all benchmarks in the box on the right, we see that for quite a number of them, things look pretty good, and they have a lot of blue. Though, there are also a number, where we clearly see that the compilation threshold is an issue, and we only get closer to the “true” median, after we crossed the threshold. For other benchmarks, there are a lot of parts that do not come close to the “true” median, like for the Vacation benchmark.
Is There A More Stable and Informative Metric?
While the above plots give us some insight in how much warmup and number of iterations are needed to gets close to the “true” median, the precision leaves a bit to be desired. To make these plots readable, I also avoided to add other colors to distinguish between values below and above the “true” median.
Originally, I wanted to use bootstrapping and bootstrap confidence intervals here, which would avoid making unsupported assumptions about the distribution of measurements. Unfortunately, it turned out to be impractical with the large data set at hand. Instead, I’ll look at a few quantiles, the arithmetic mean, and minimum. The minimum has been shown before as a metric that stabilizes fast, though, I assume that it does hide possibly important changes in practice.
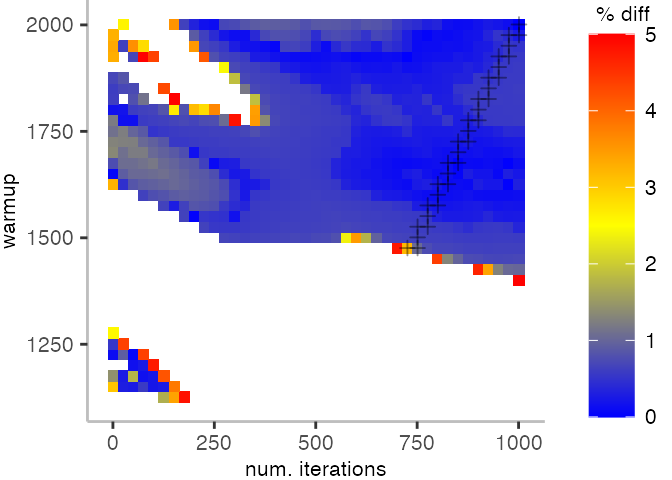
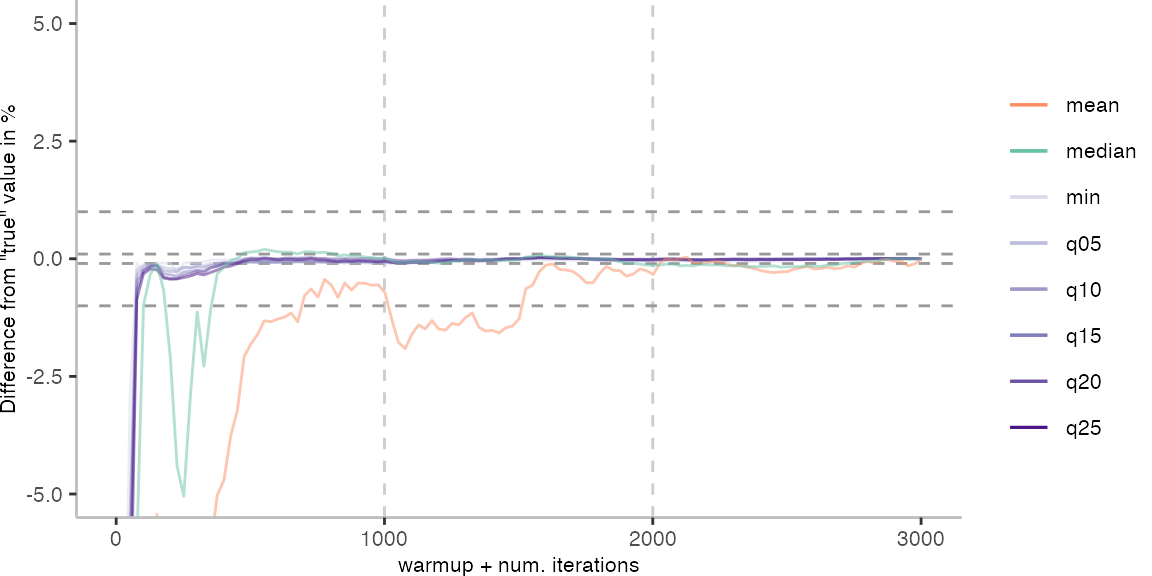
To investigate these metrics, I will look at the pairs of warmup and number of iterations that fall roughly on the diagonal of the plots in the last section, indicated by the crosses you may have noticed.
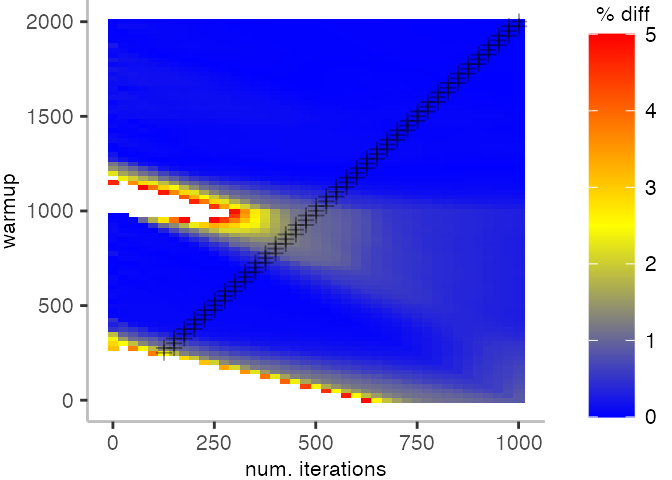
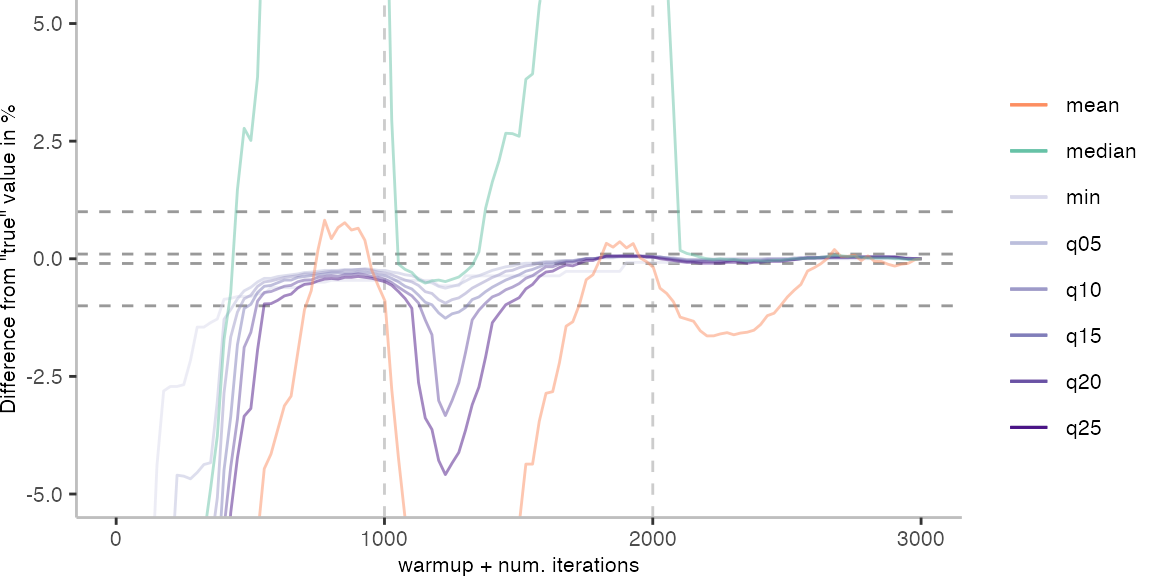
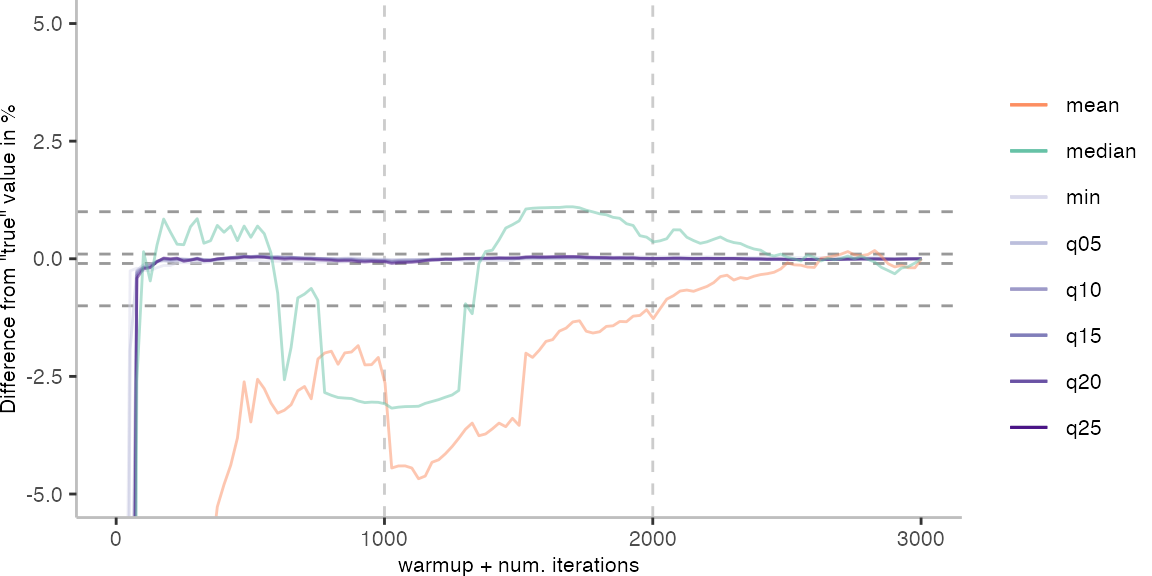
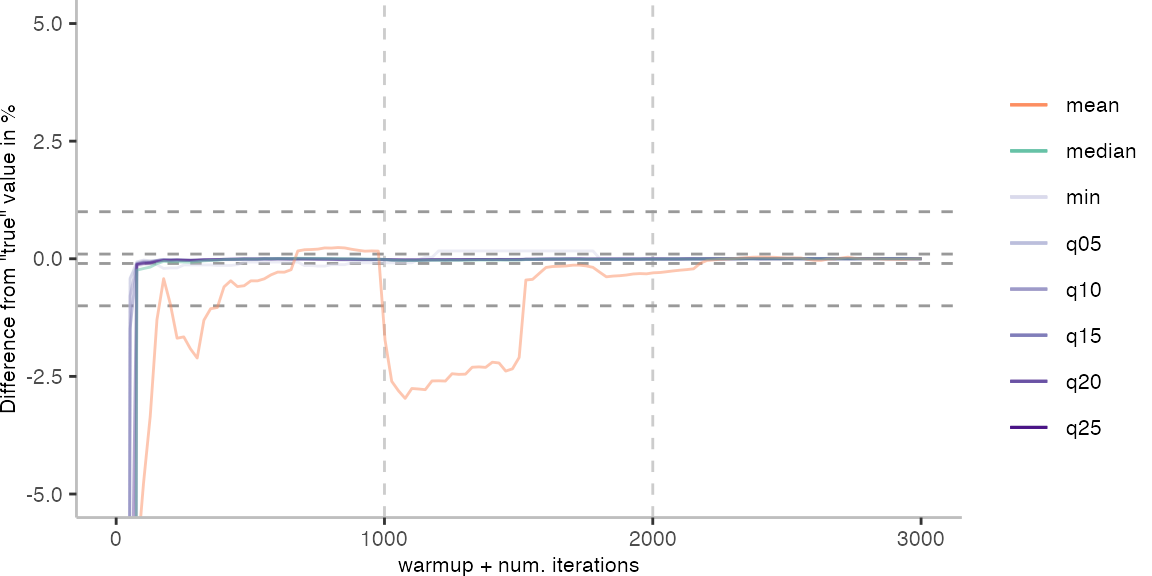
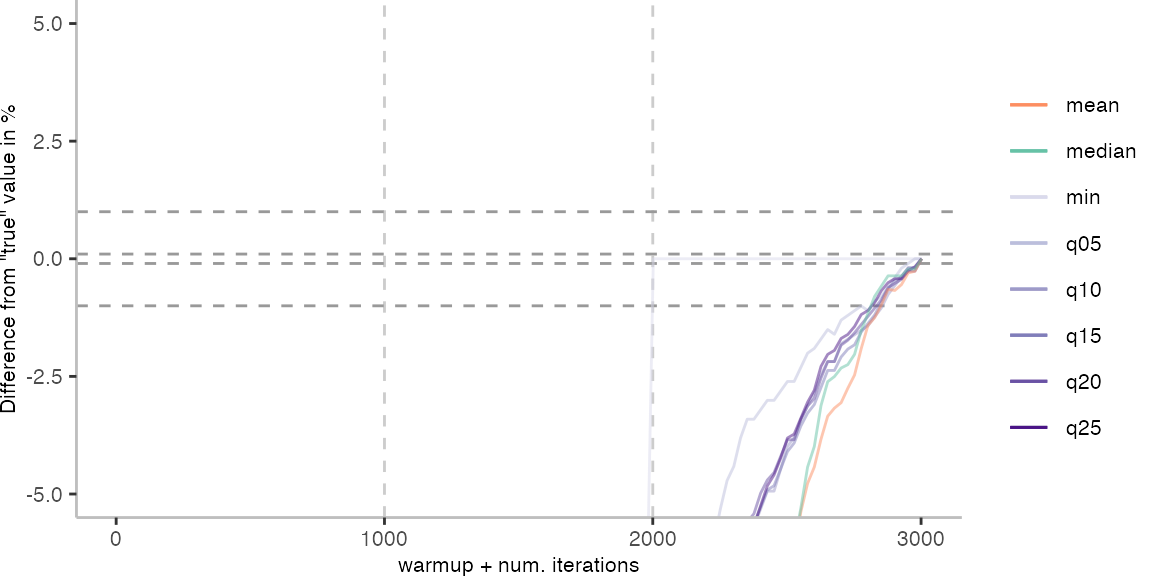
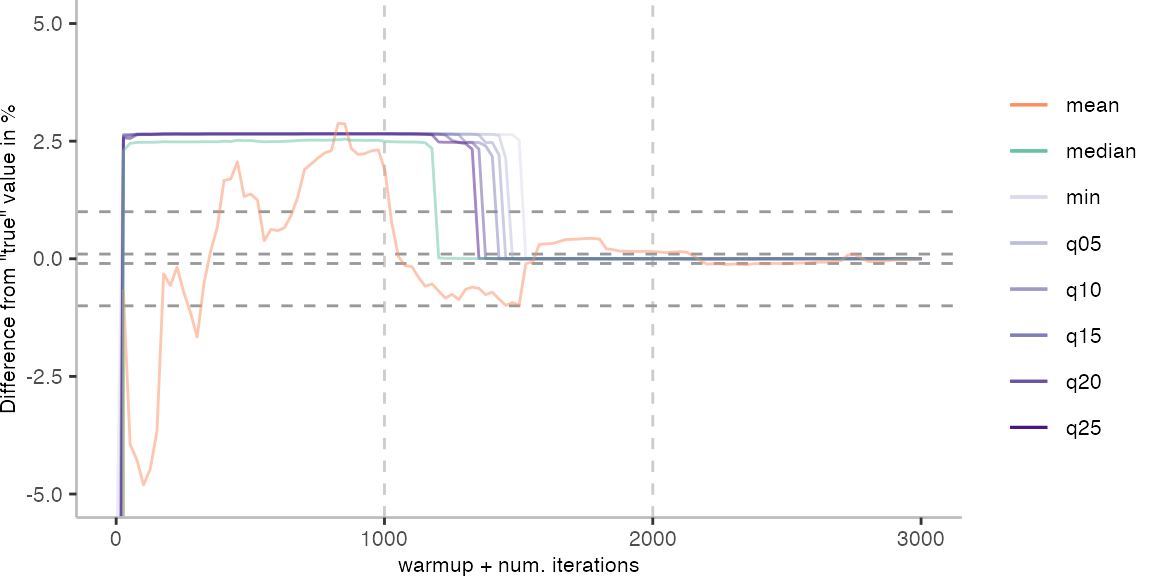
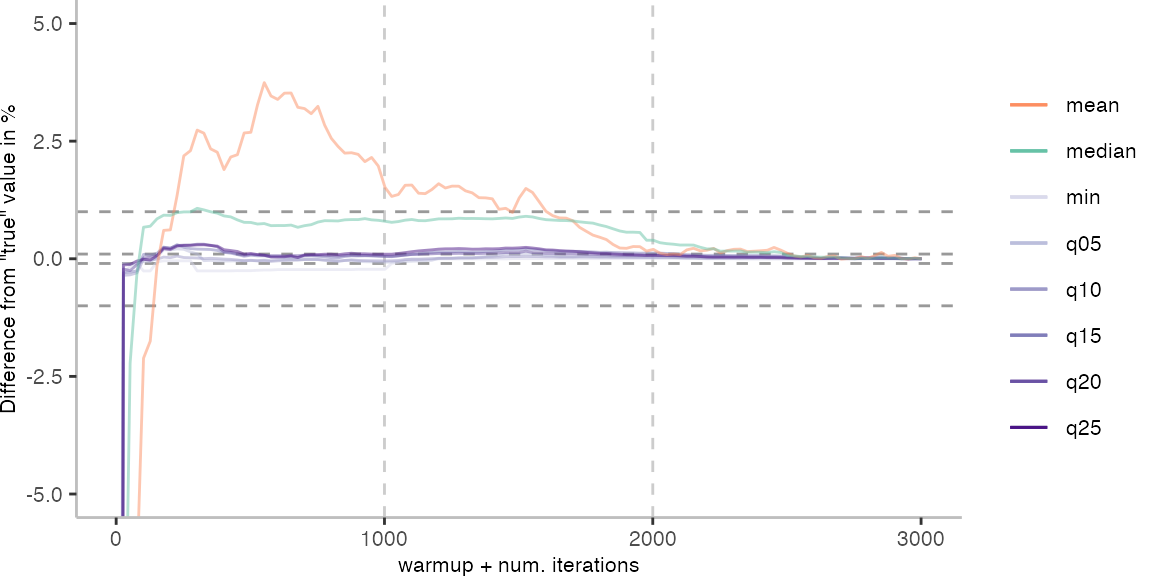
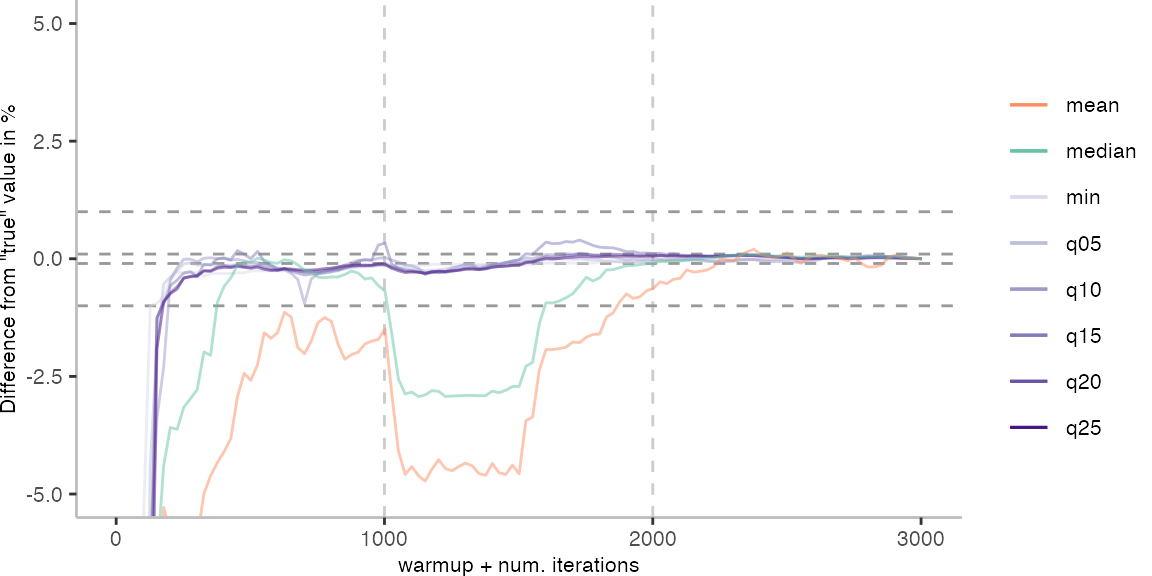
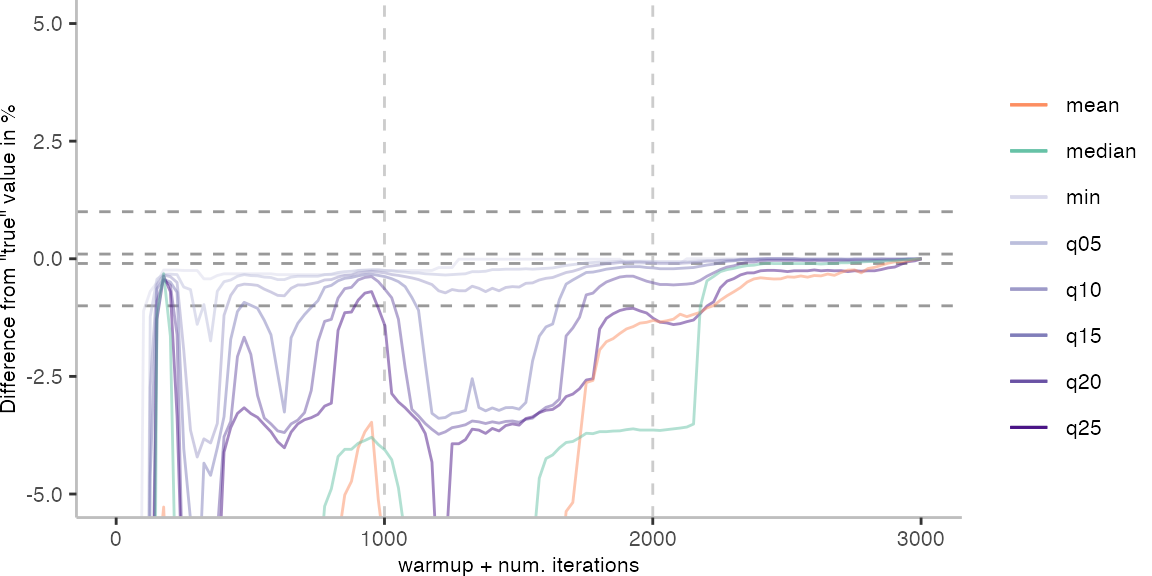
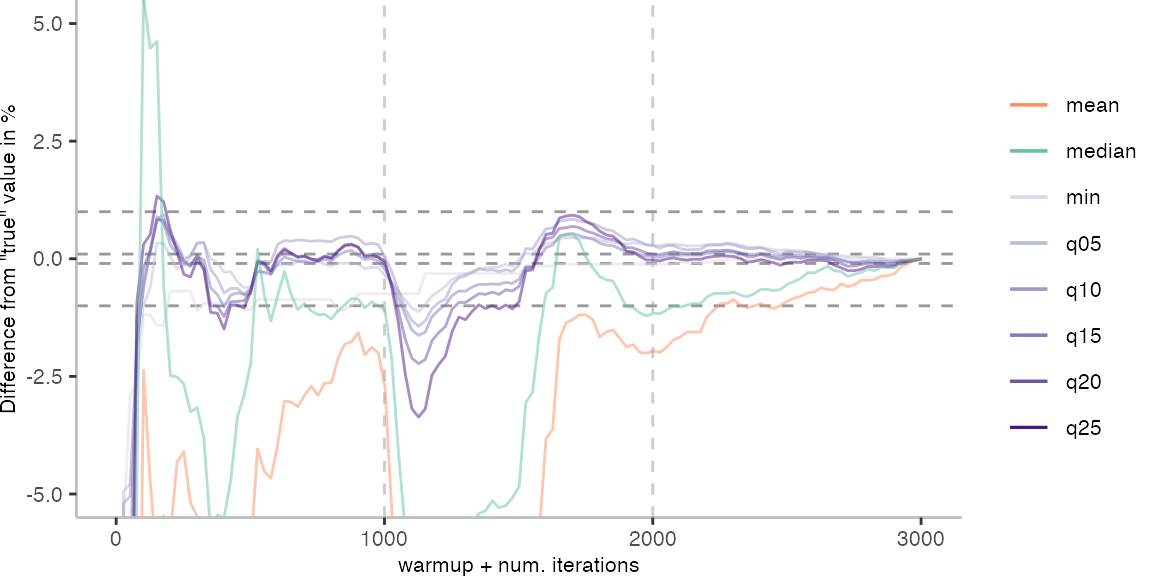
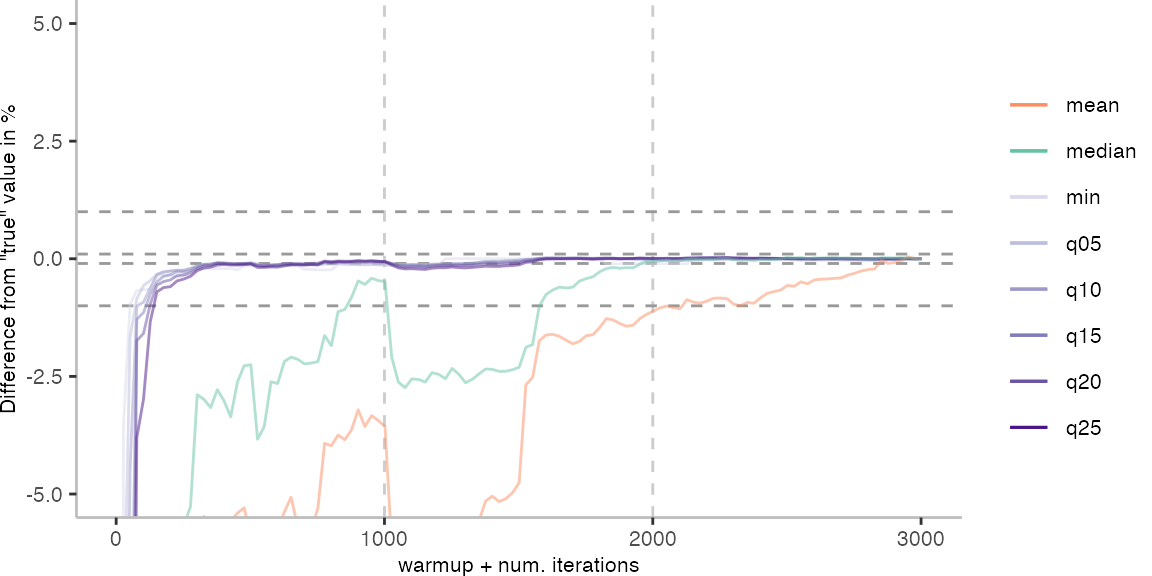
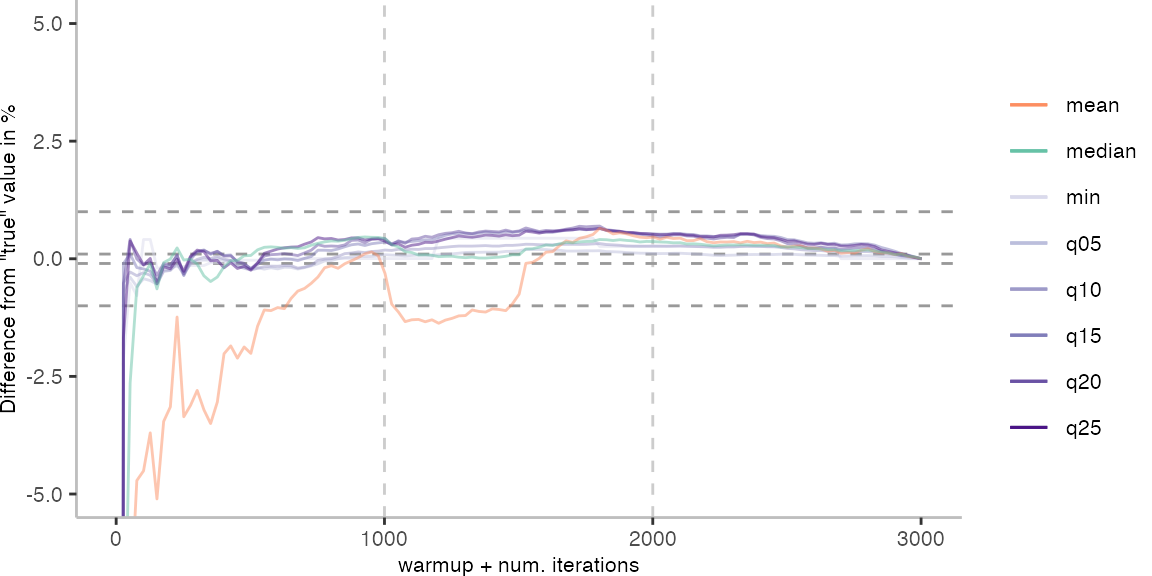
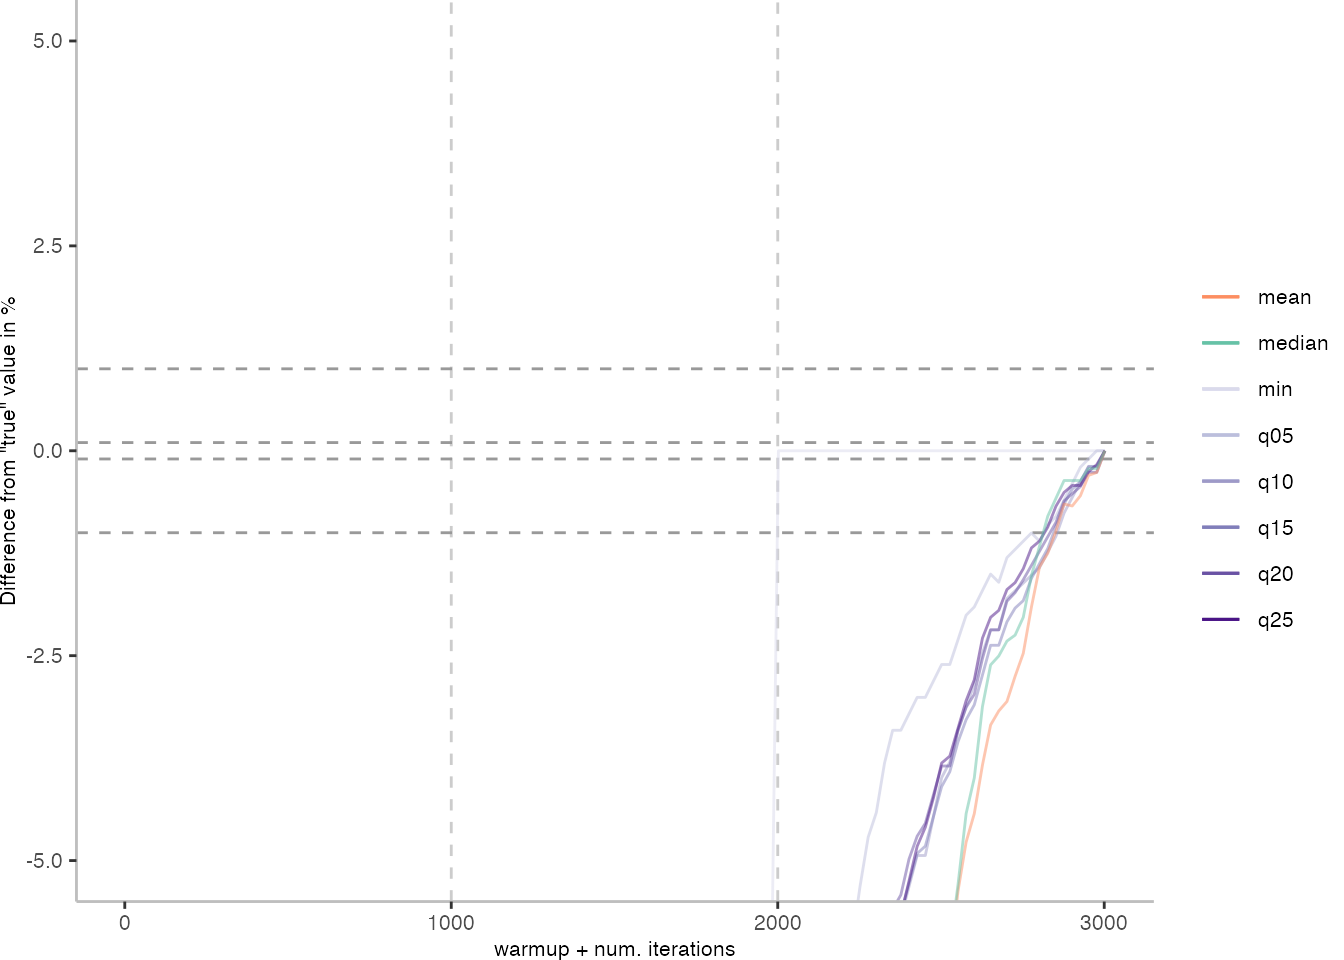
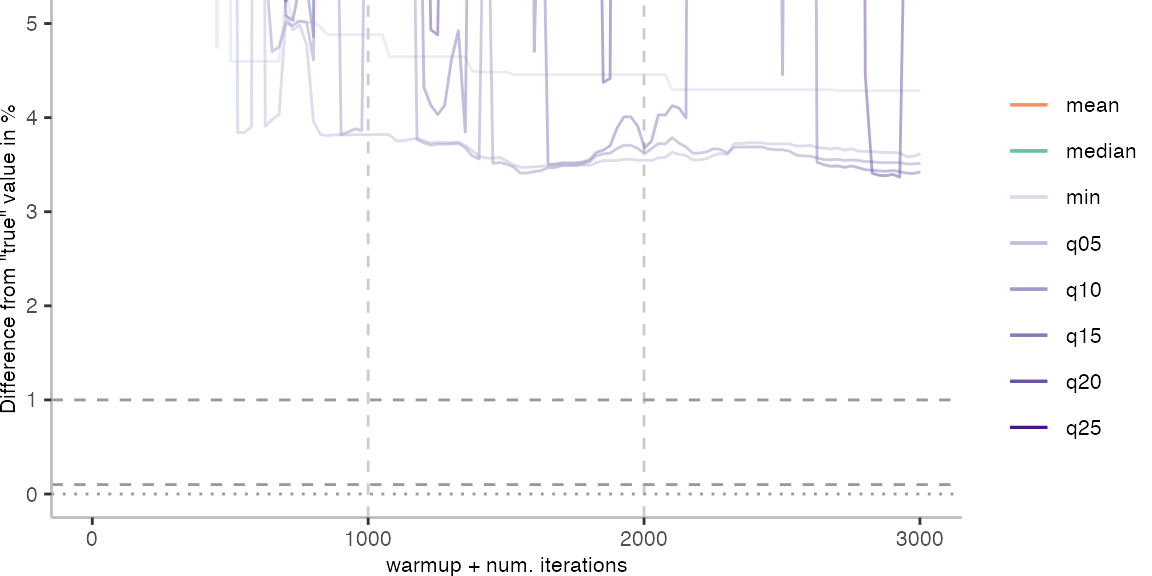
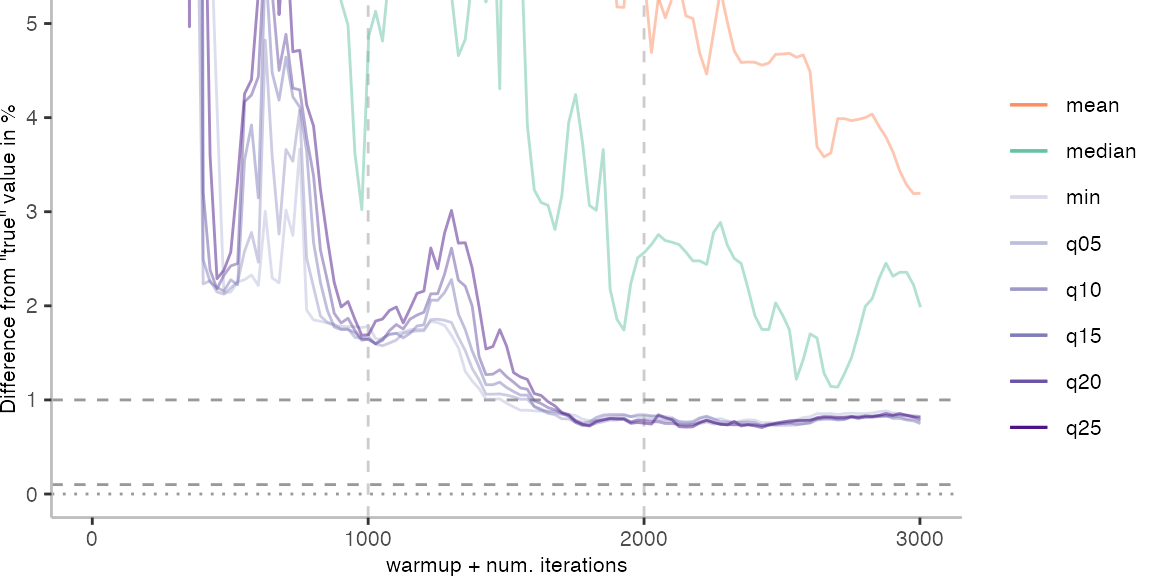
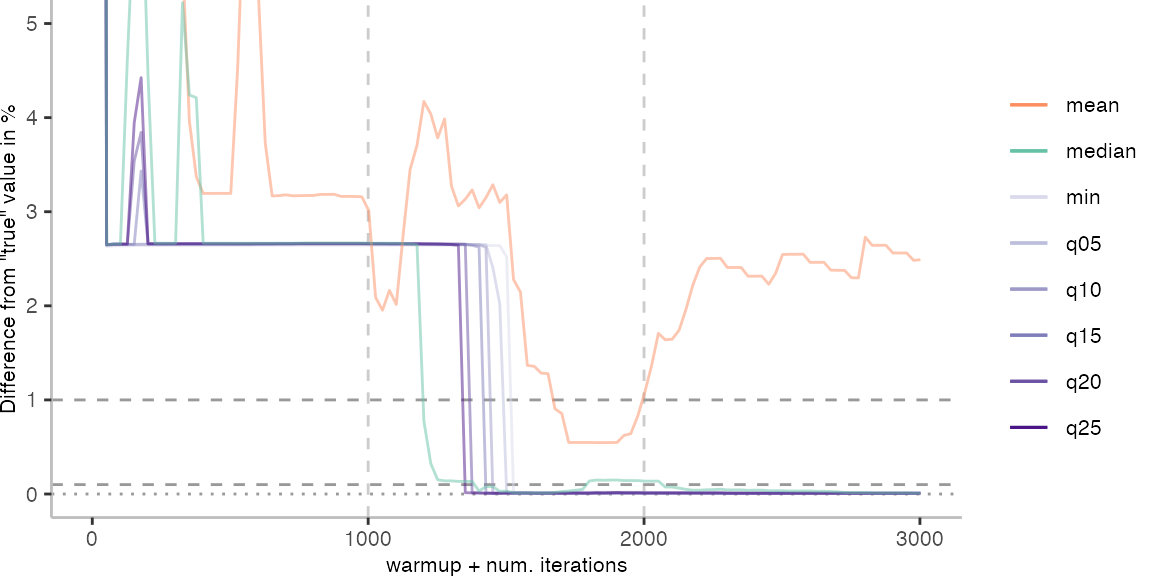
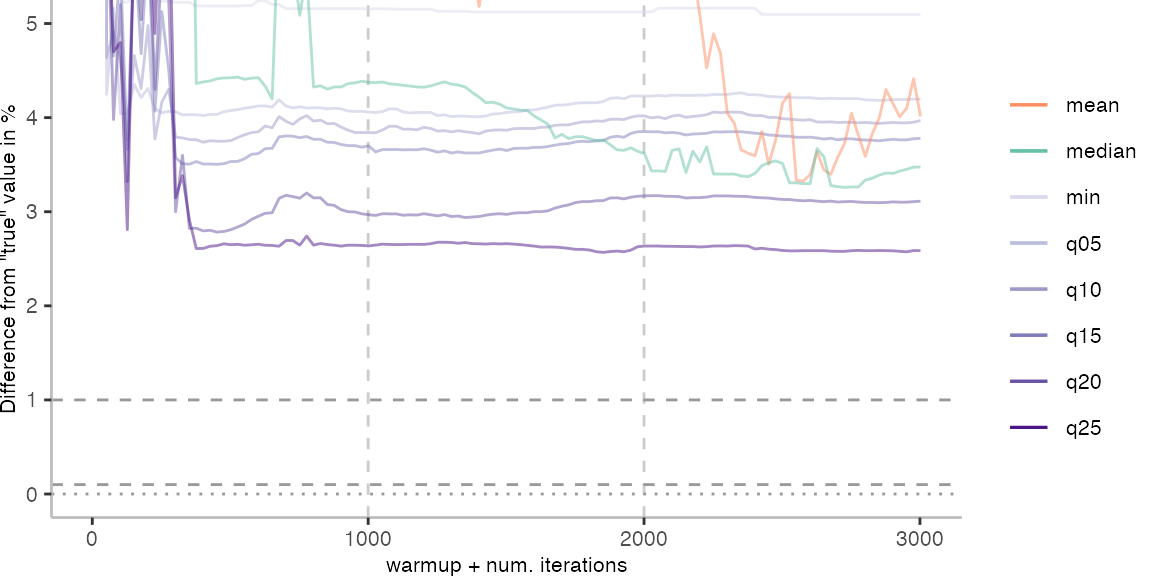
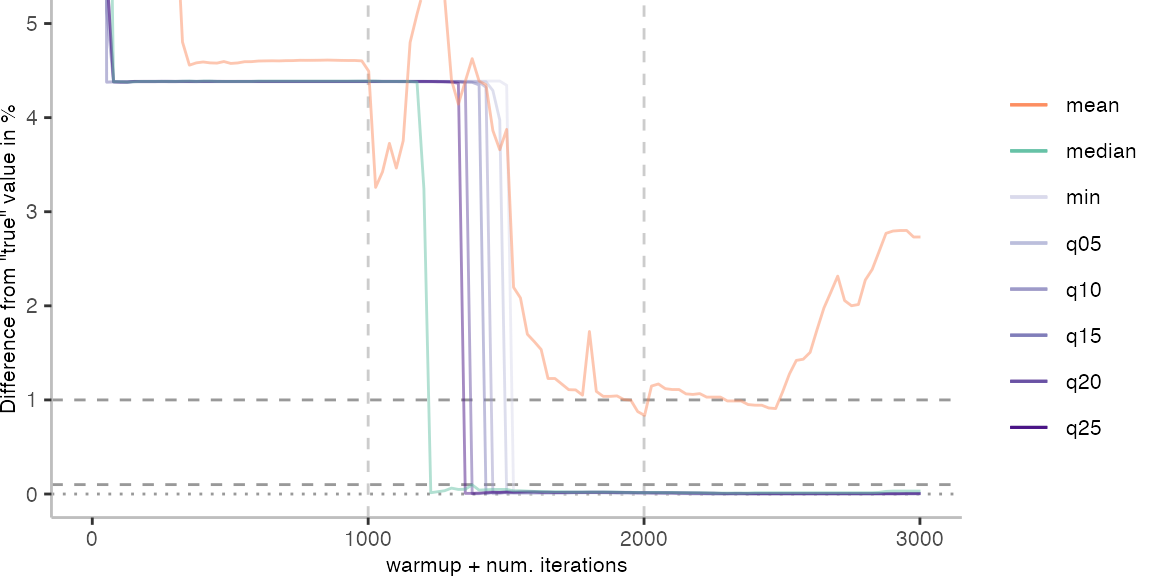
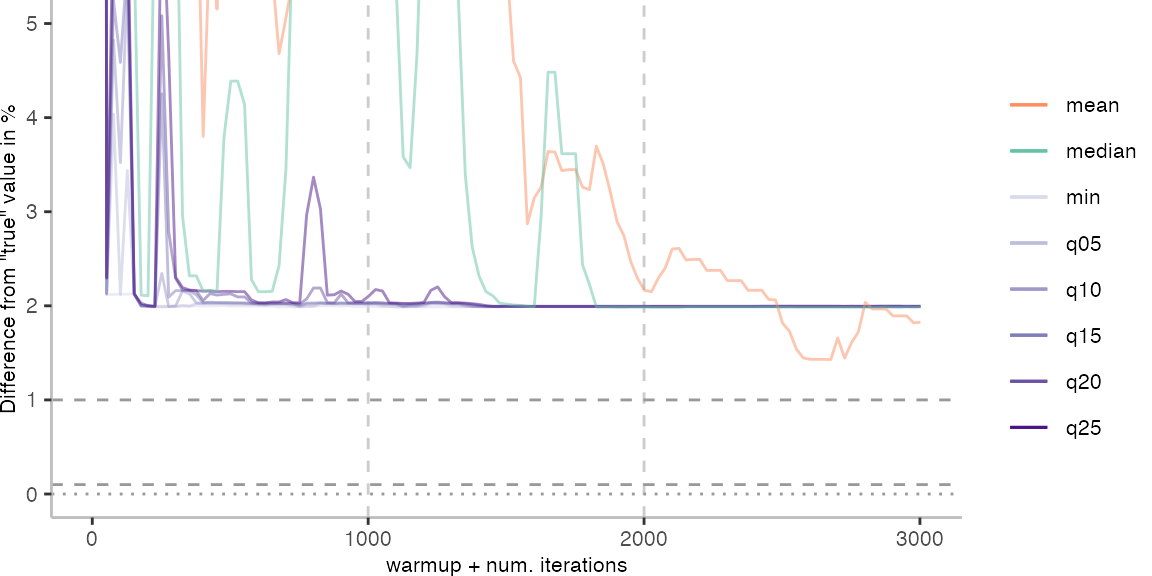
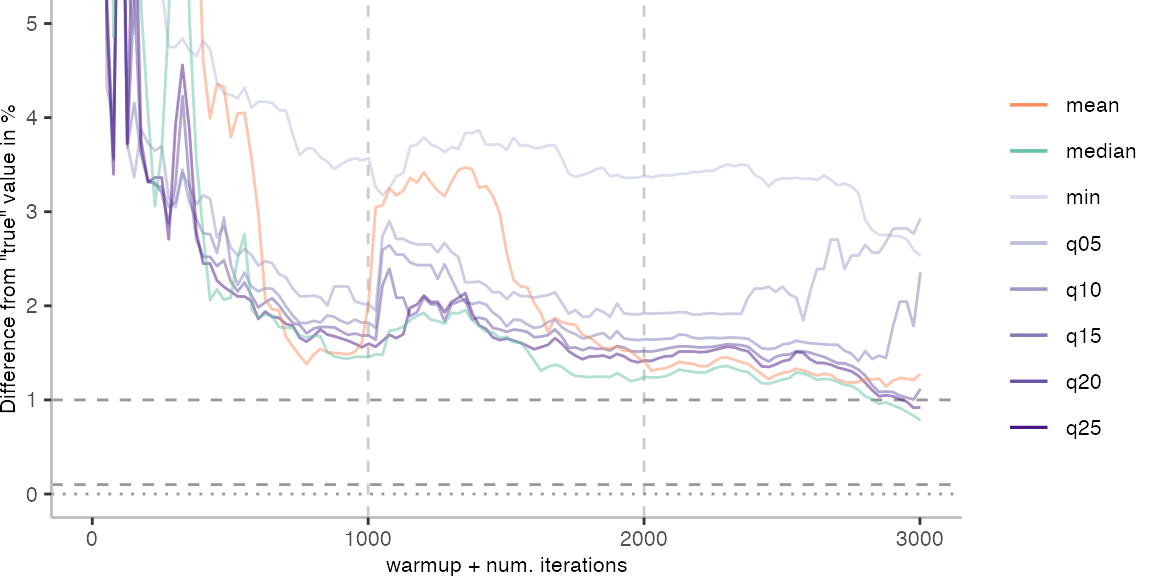
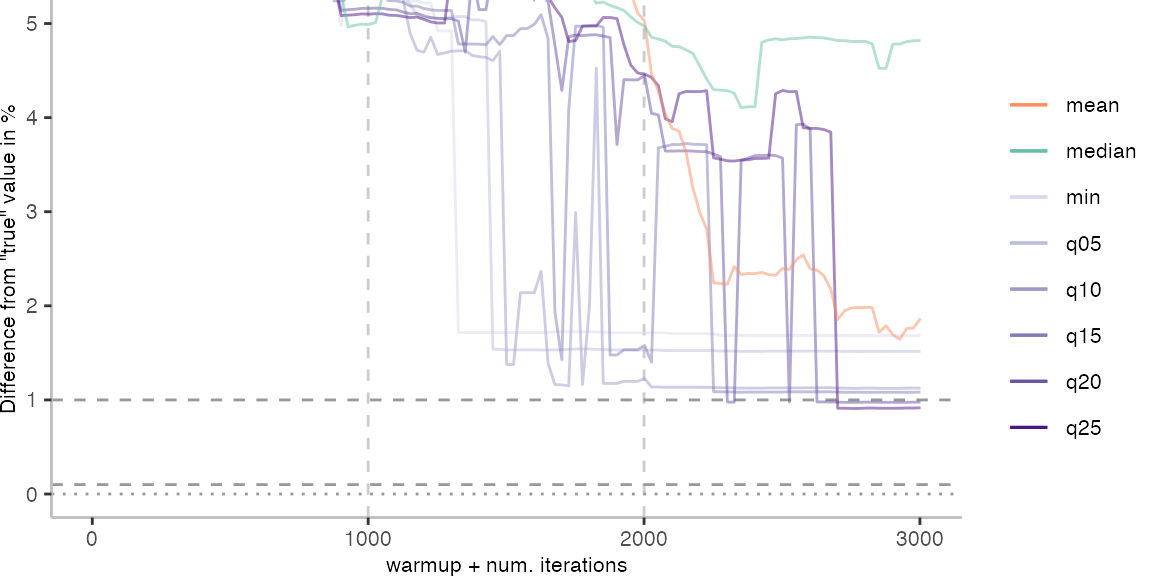
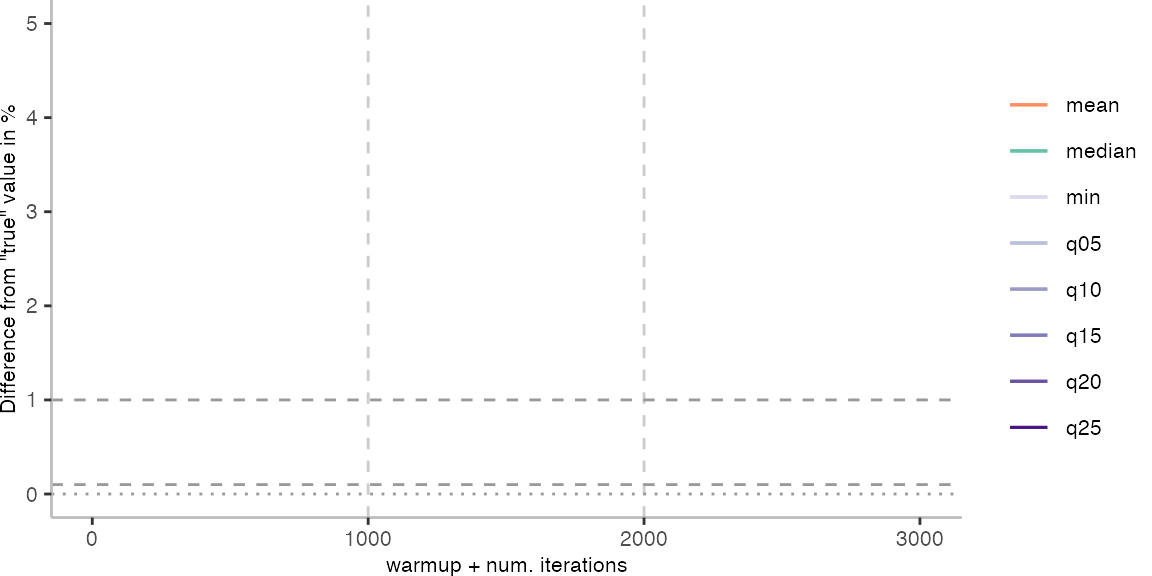
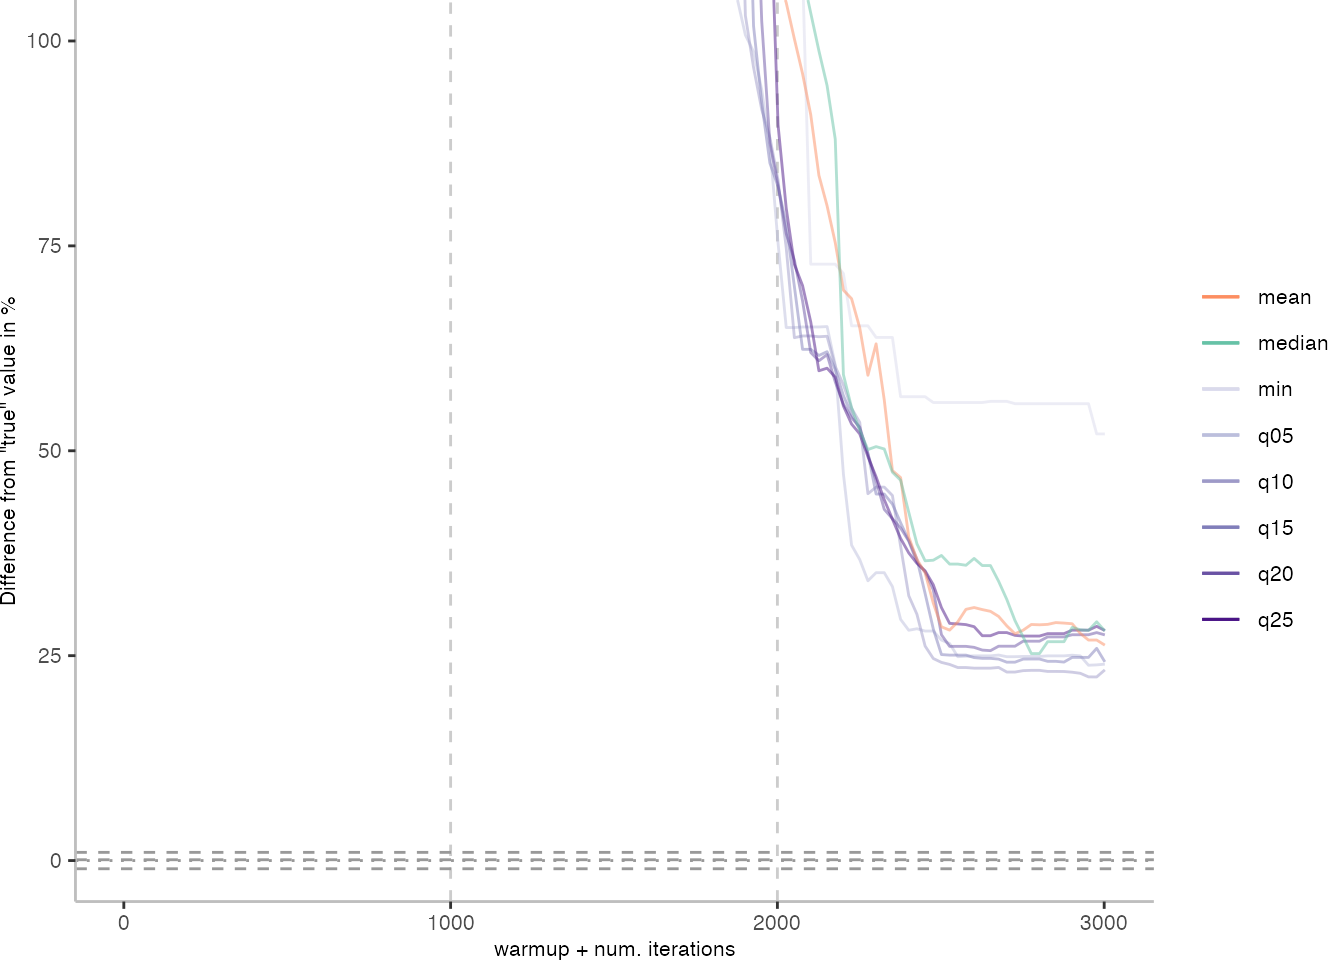
As before, the first plot shows the results for IntegerLoop. The plot focuses on the range of 5% above and 5% below the “true” value assumed for each metric.

Because of the difference of the later performance to the first 1000 iterations, we see the metrics converging to the “true” value only after the 1000th iteration. Interestingly, the median start converging first, while the minimum comes in later. This happens here because we first need to reach the point where we discard enough warmup iterations, before the minimum is what we expect it to be based on the last 1000 iterations.
All Difference Plots
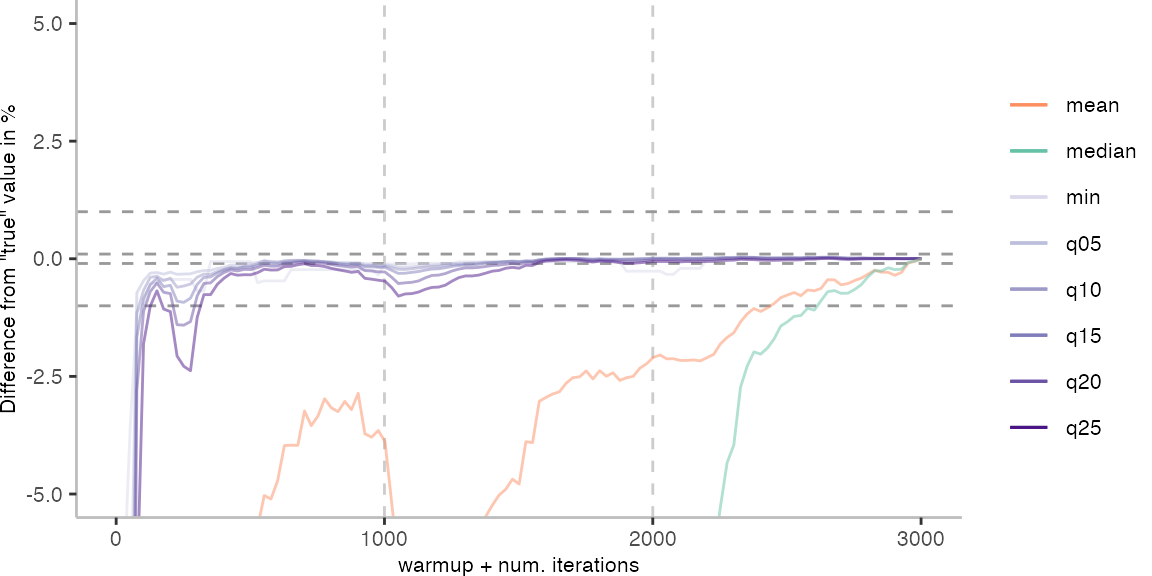
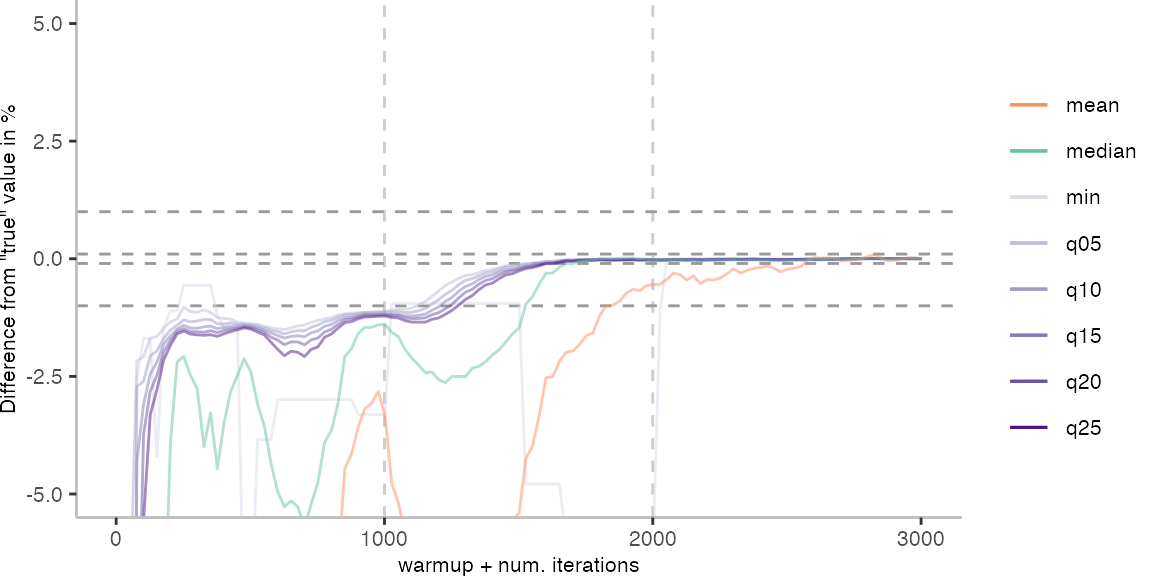
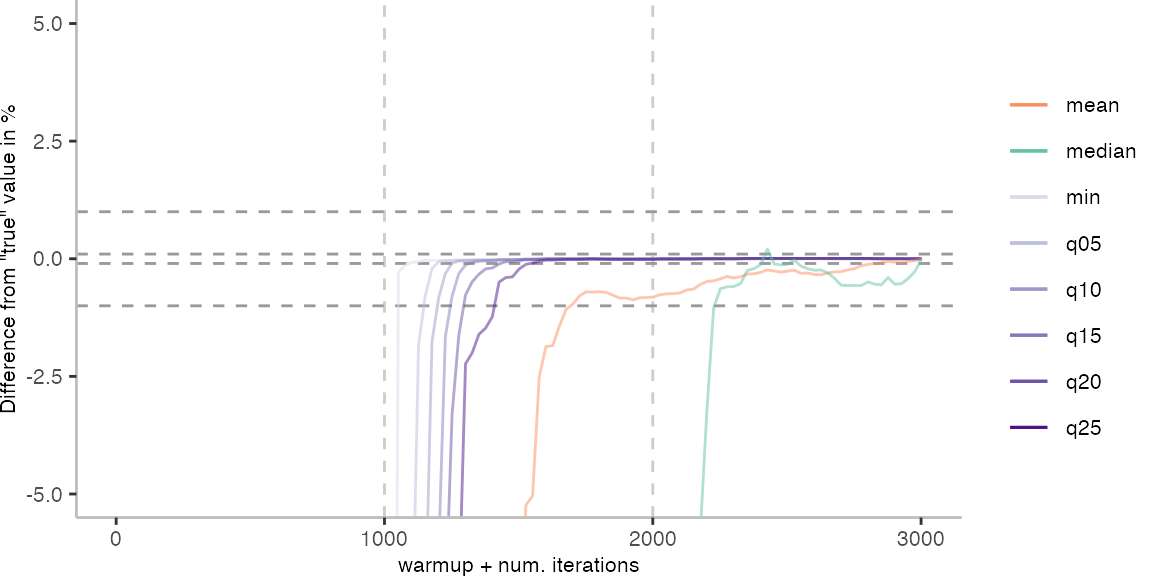

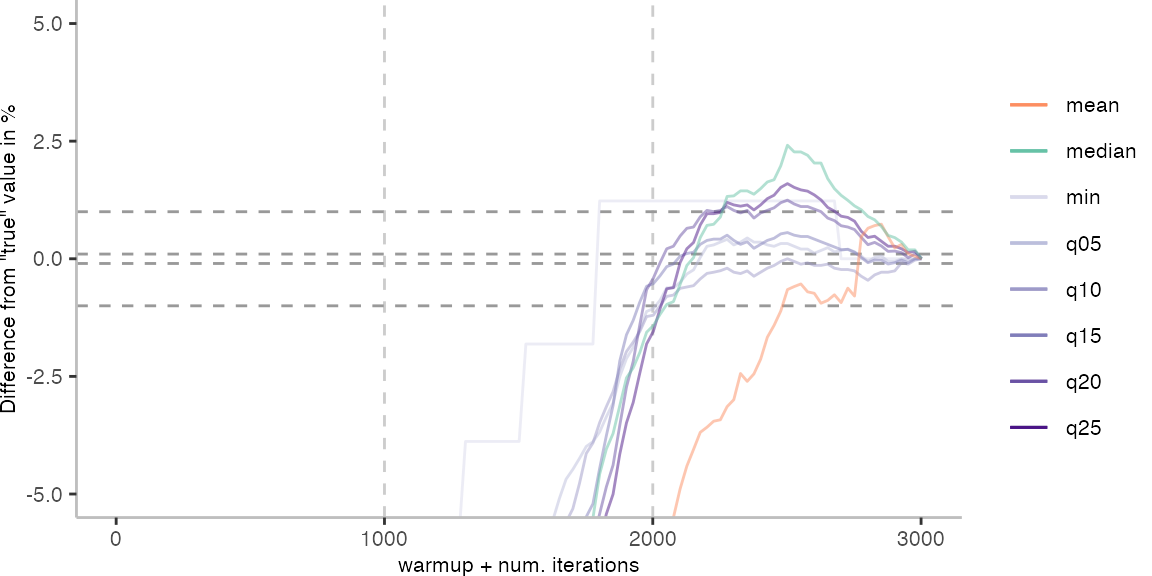
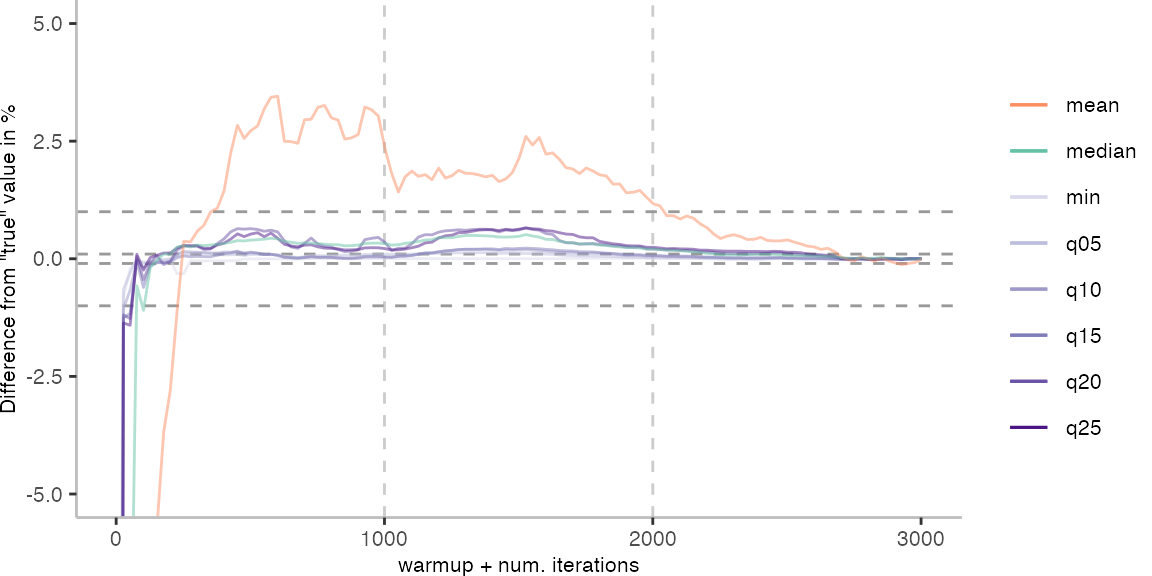
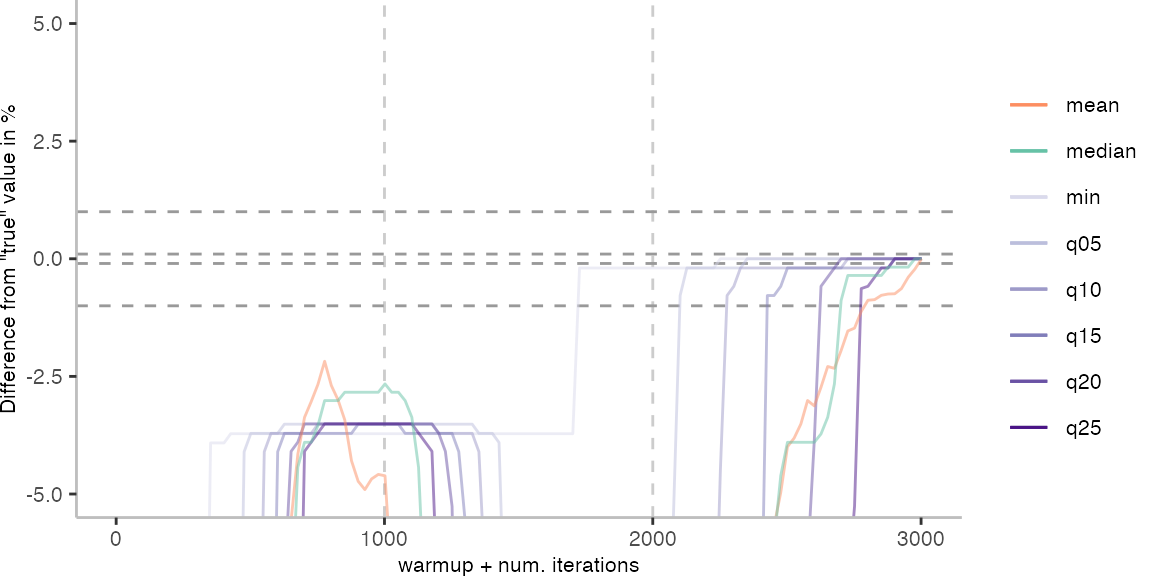
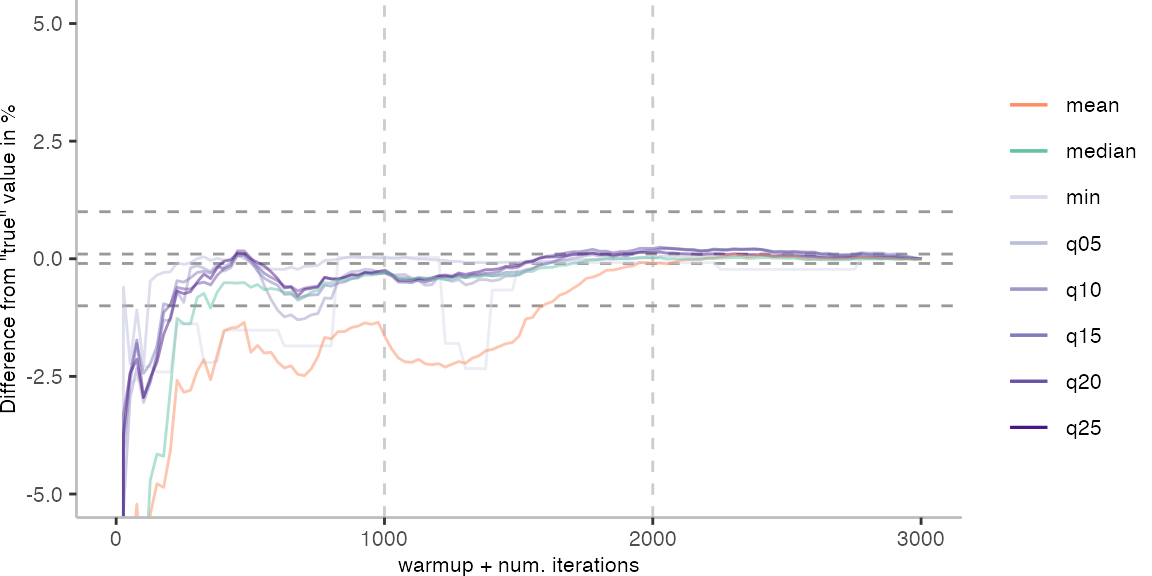
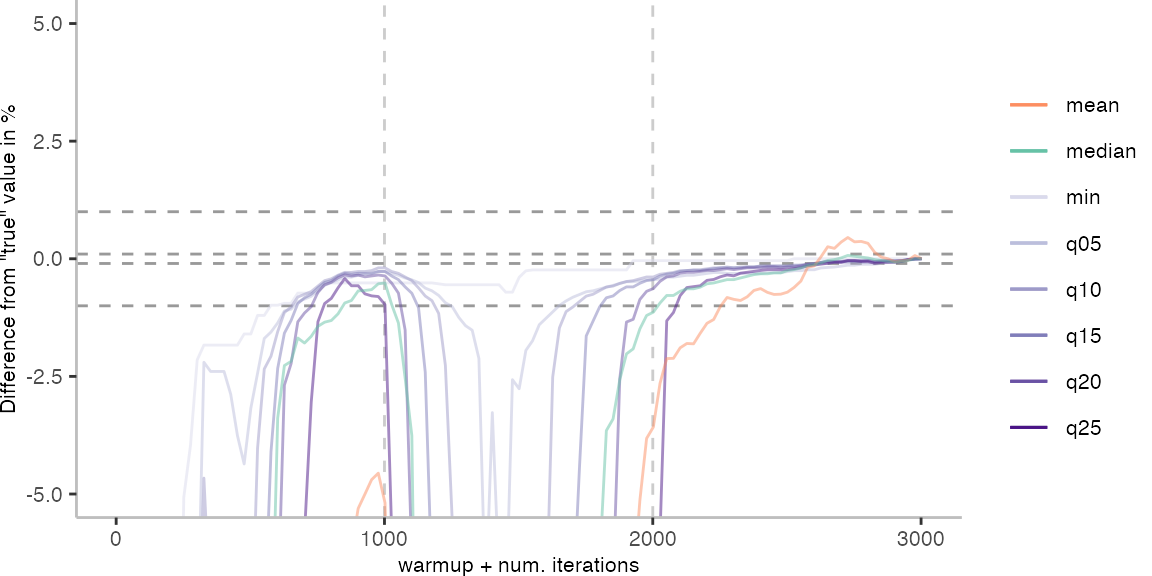
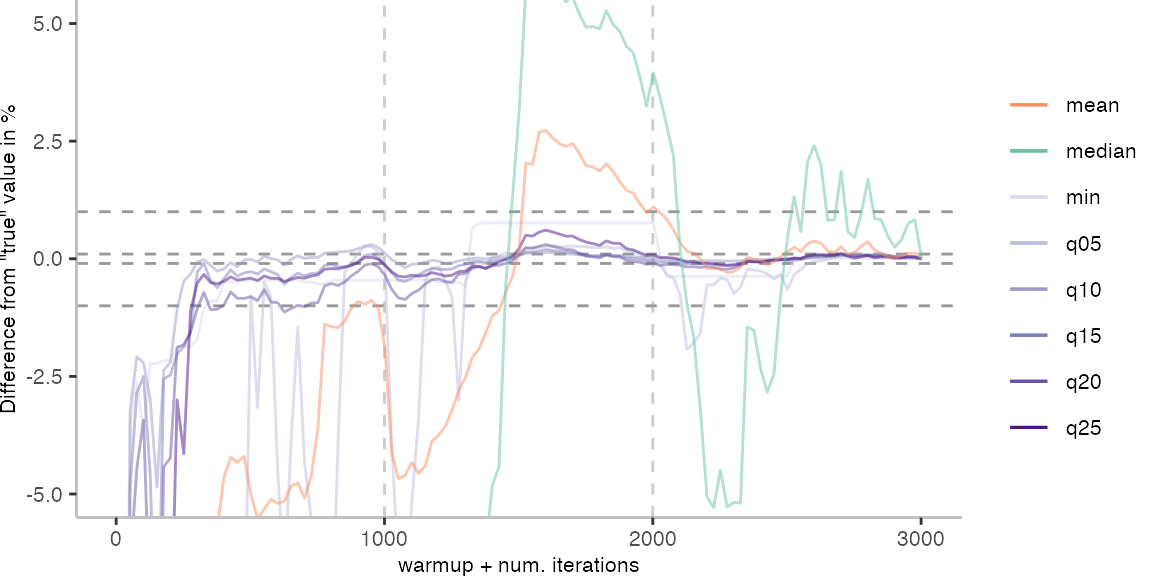
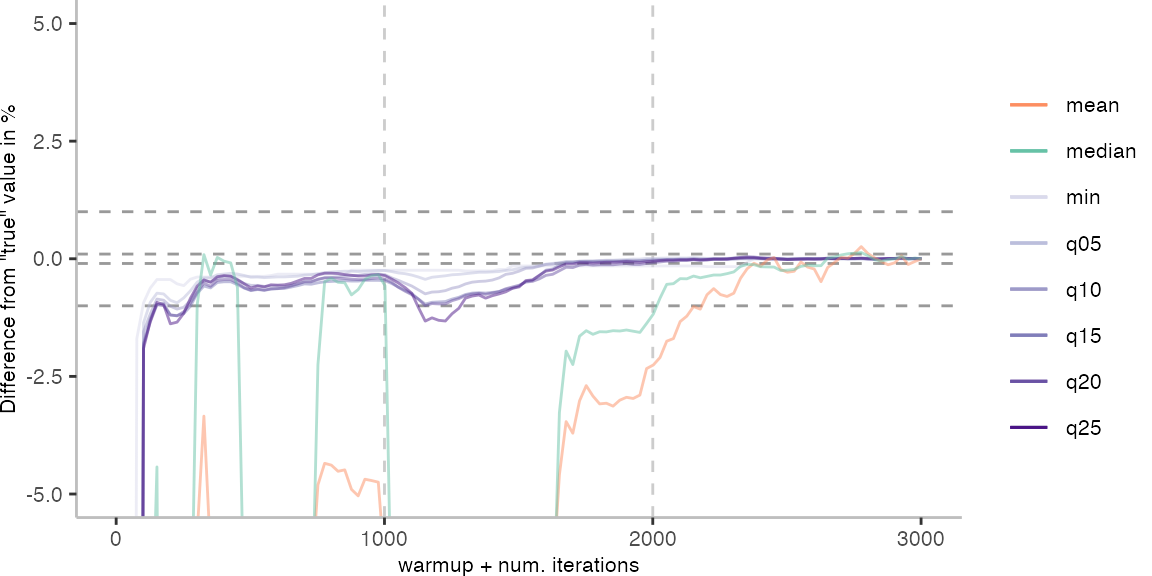
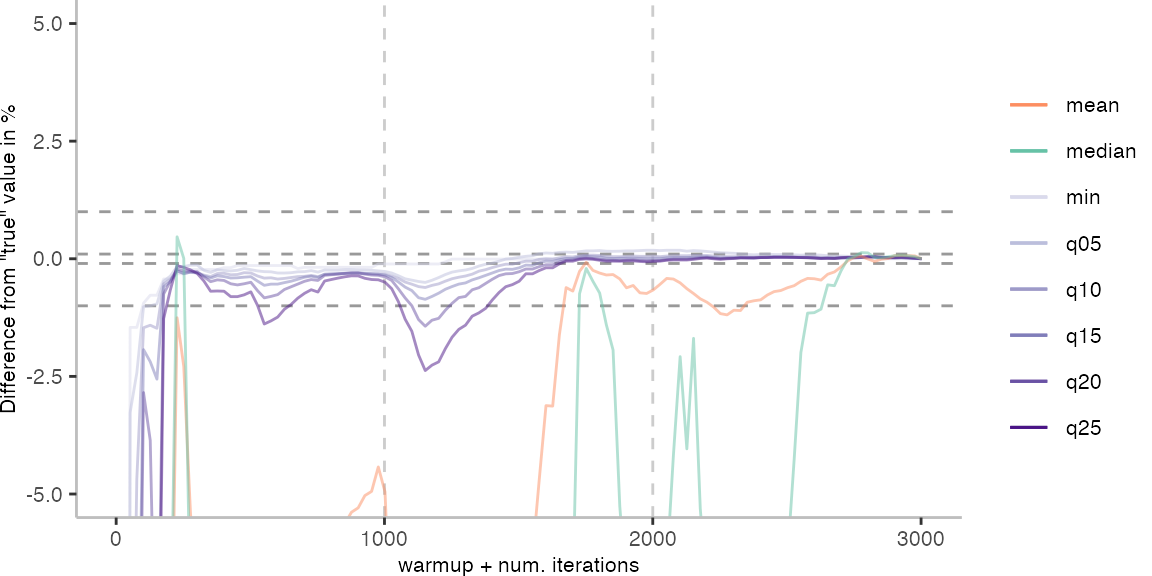
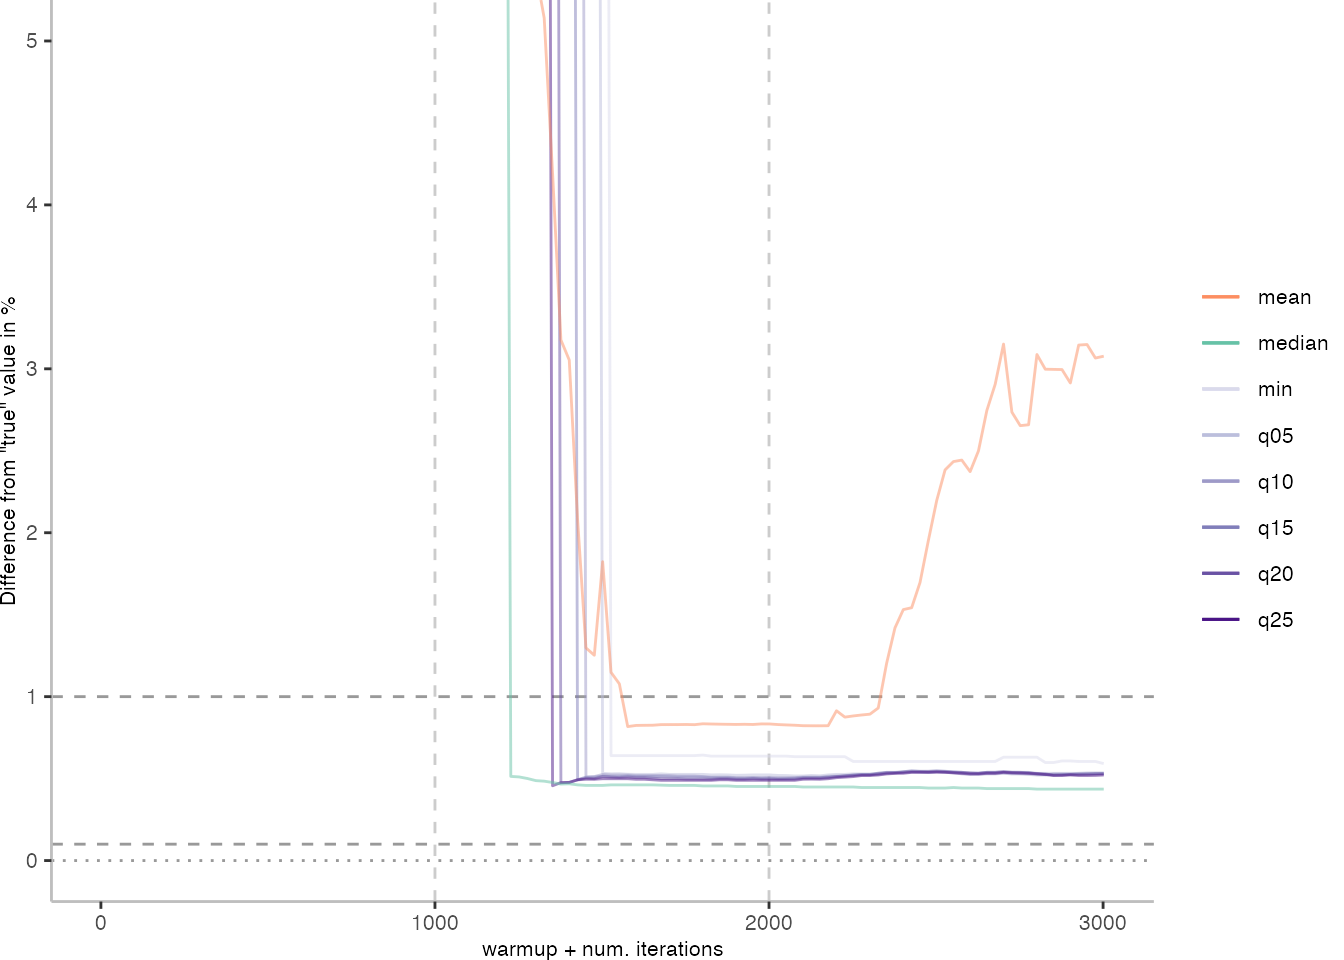
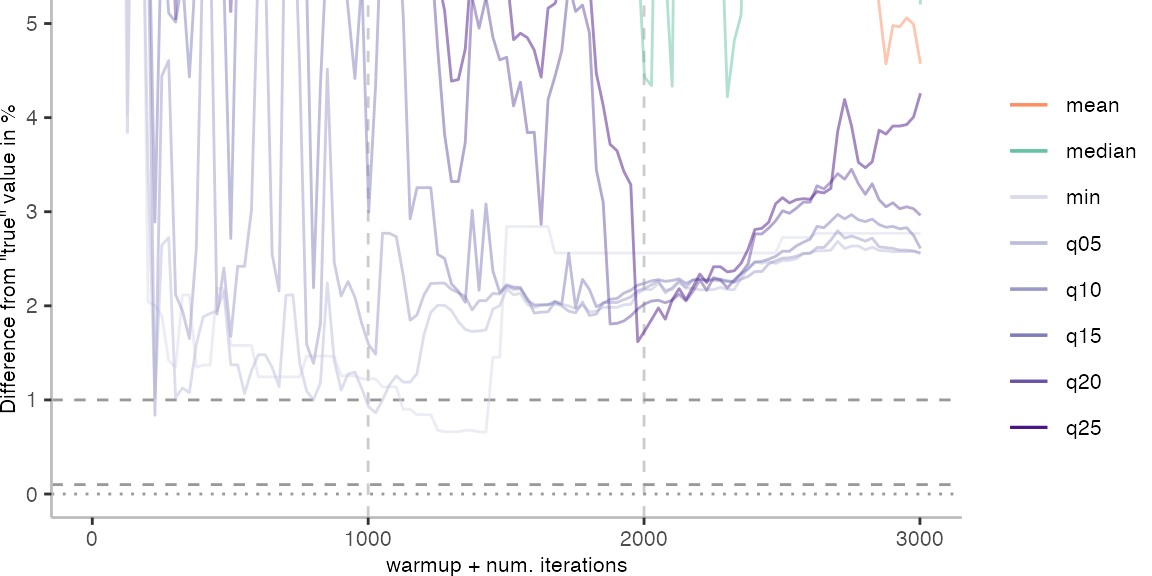
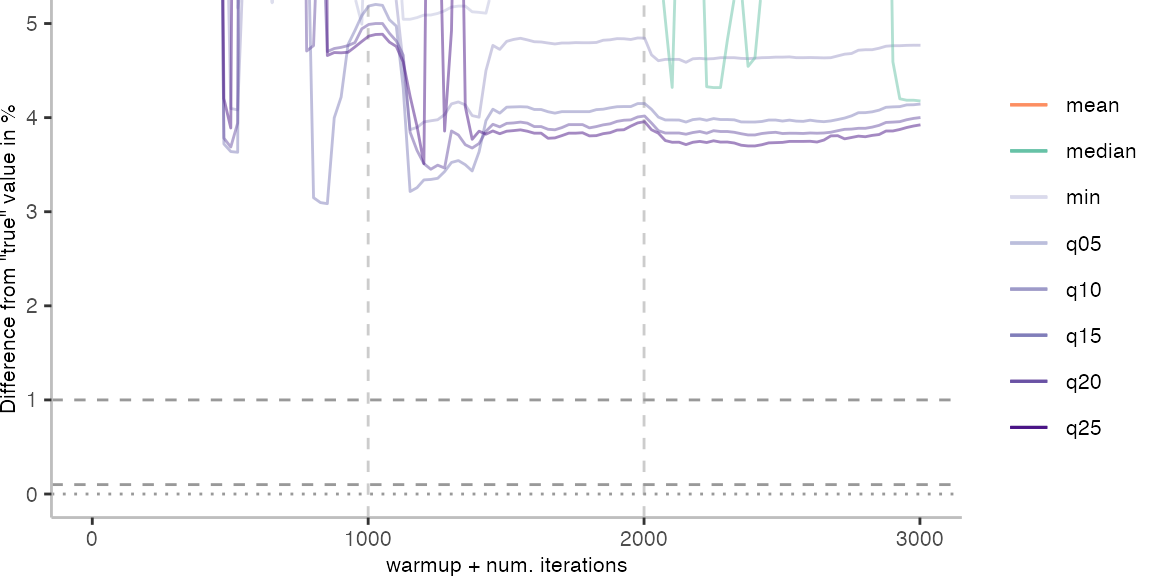
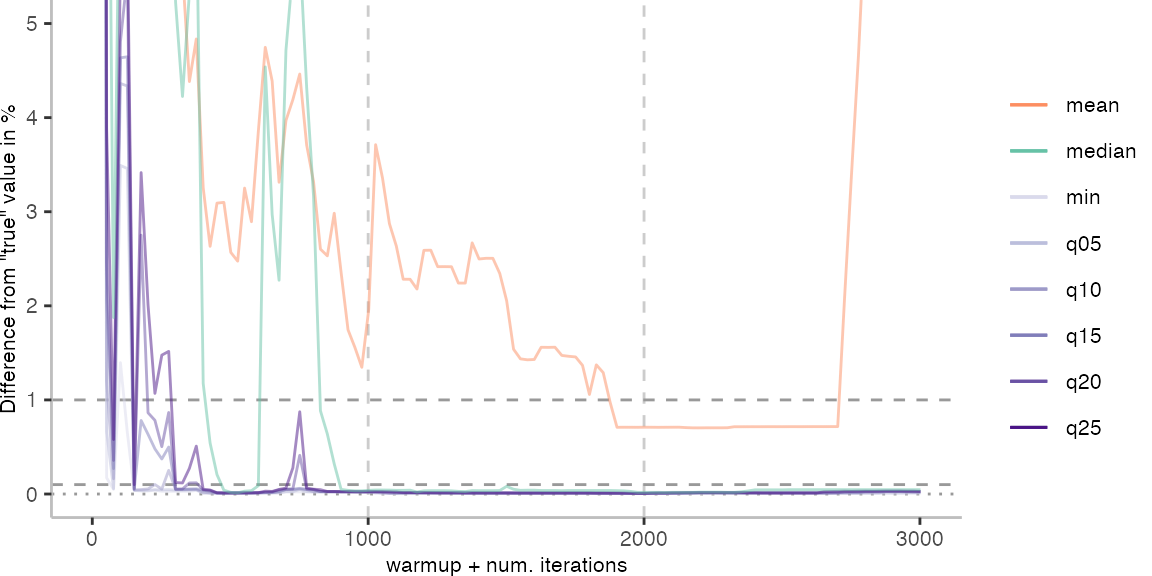
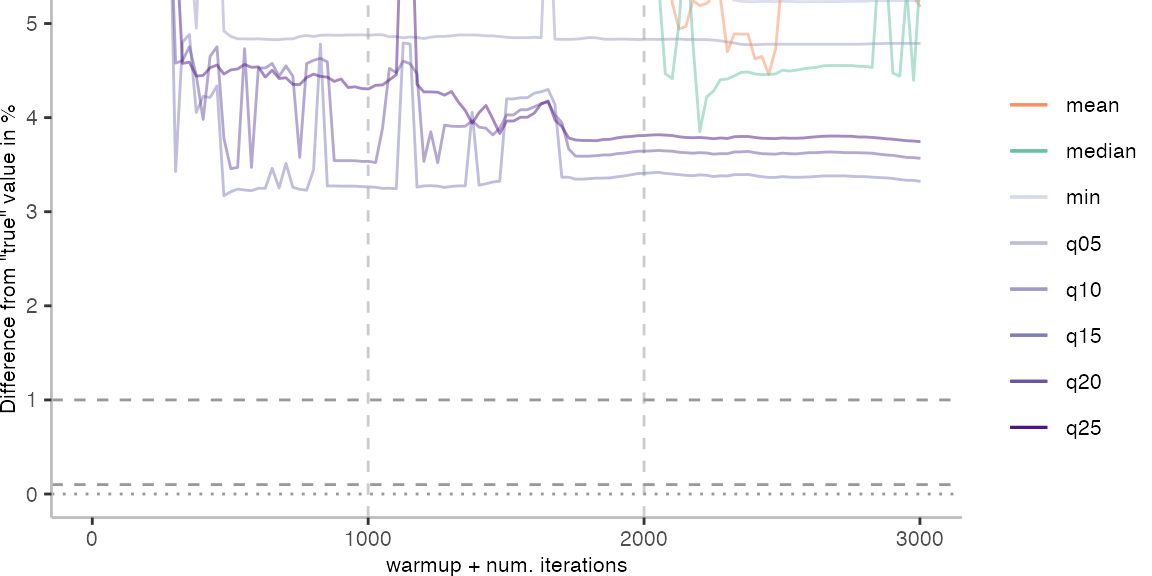
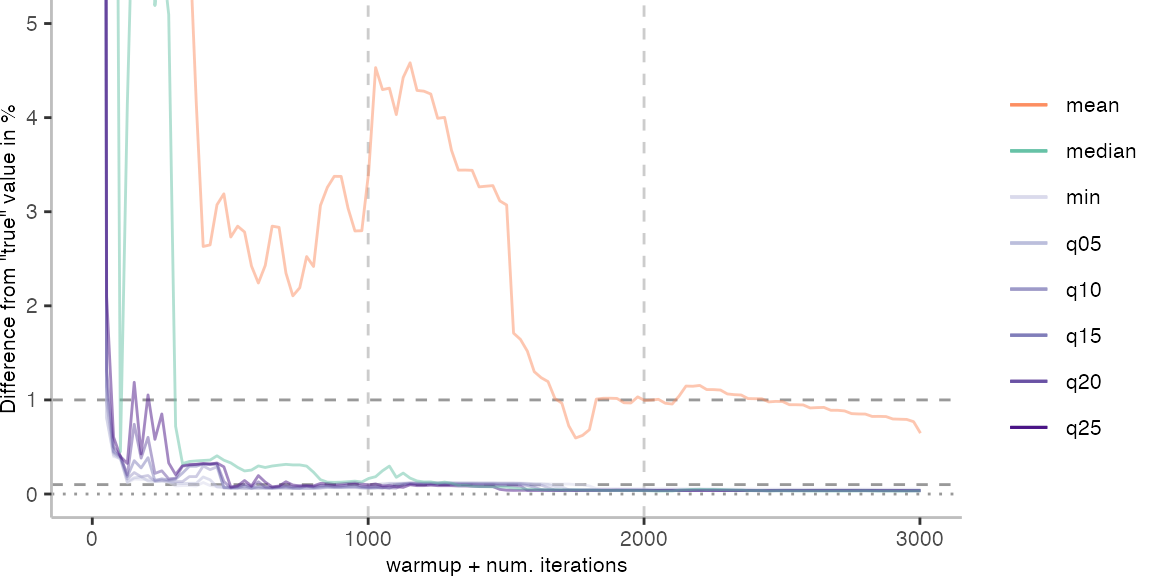
For the Vacation benchmark, the plot again looks very different. As we would expect from previous plots, the metrics converge very late. Though, here the minimum and the lower quantiles converge before the median and mean.
The other plots are again in a box on the right.
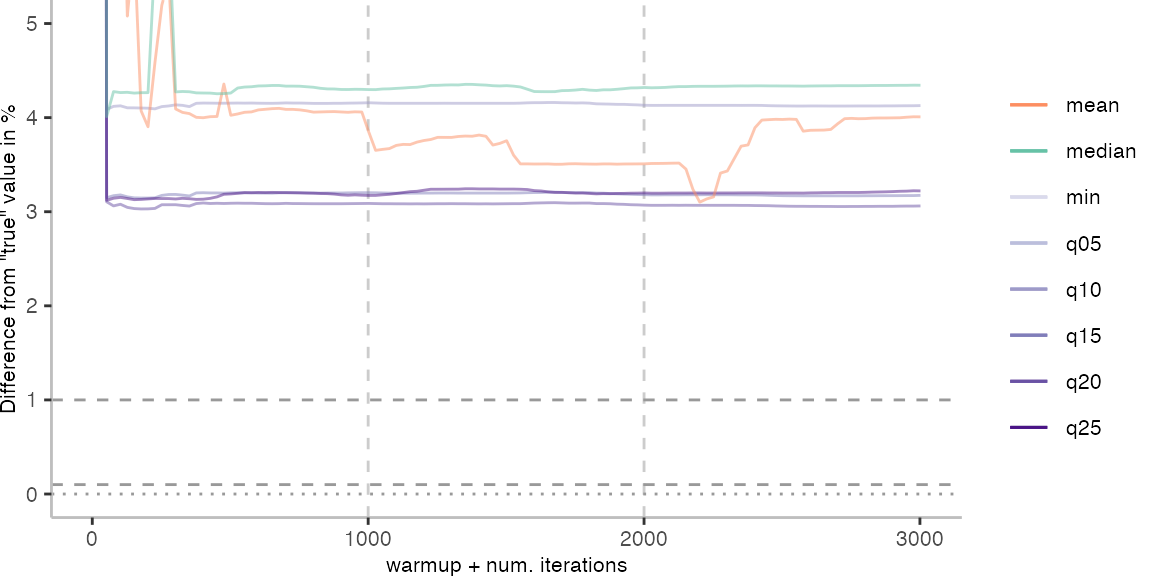
What’s the Largest Differnce from the “True” Value for these Metrics?
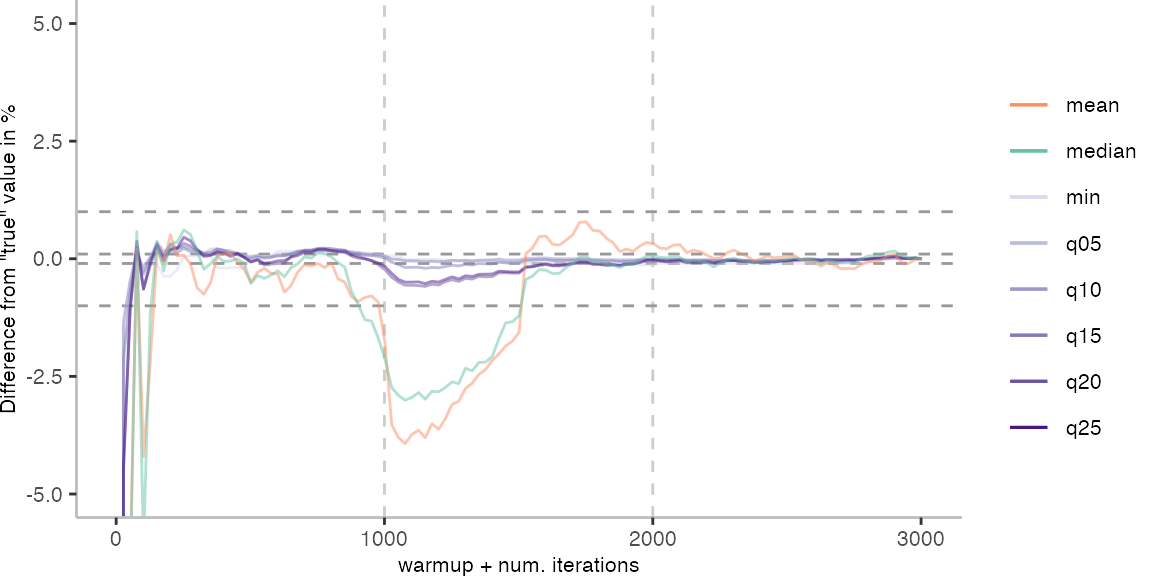
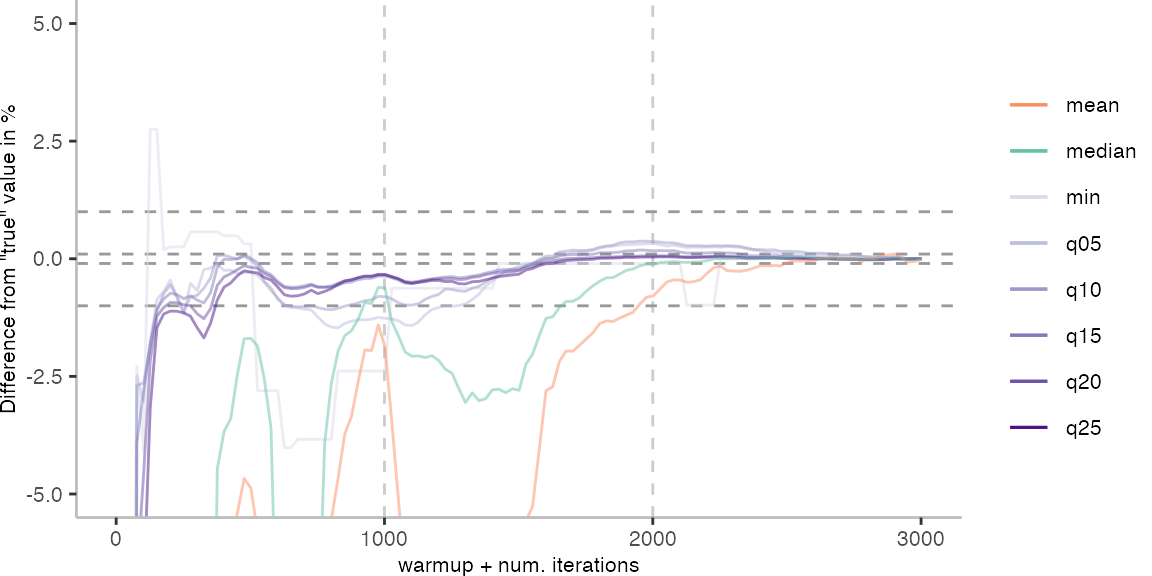
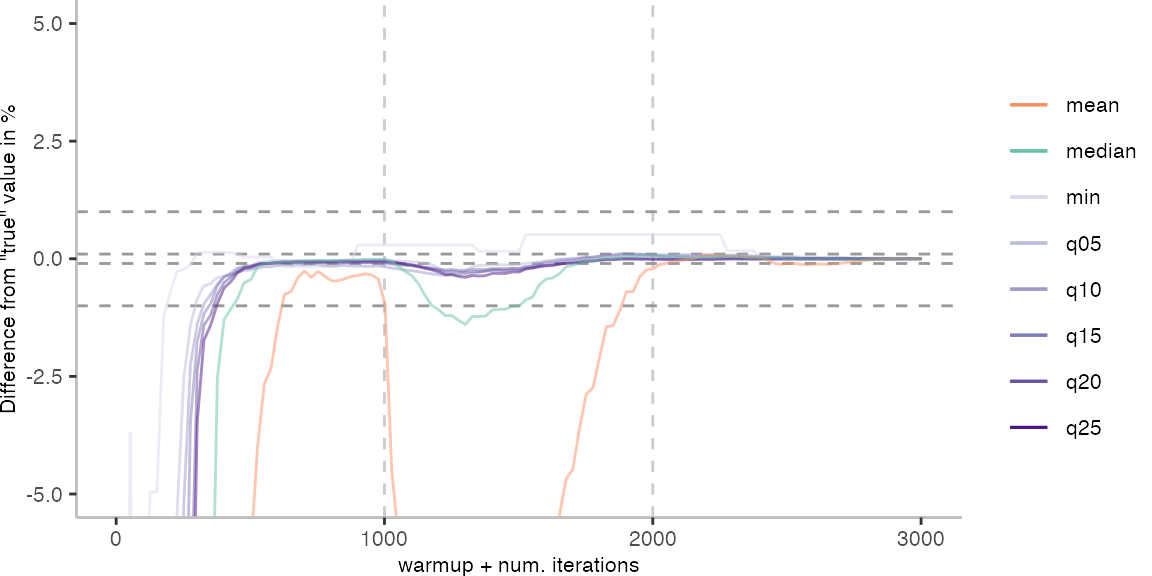
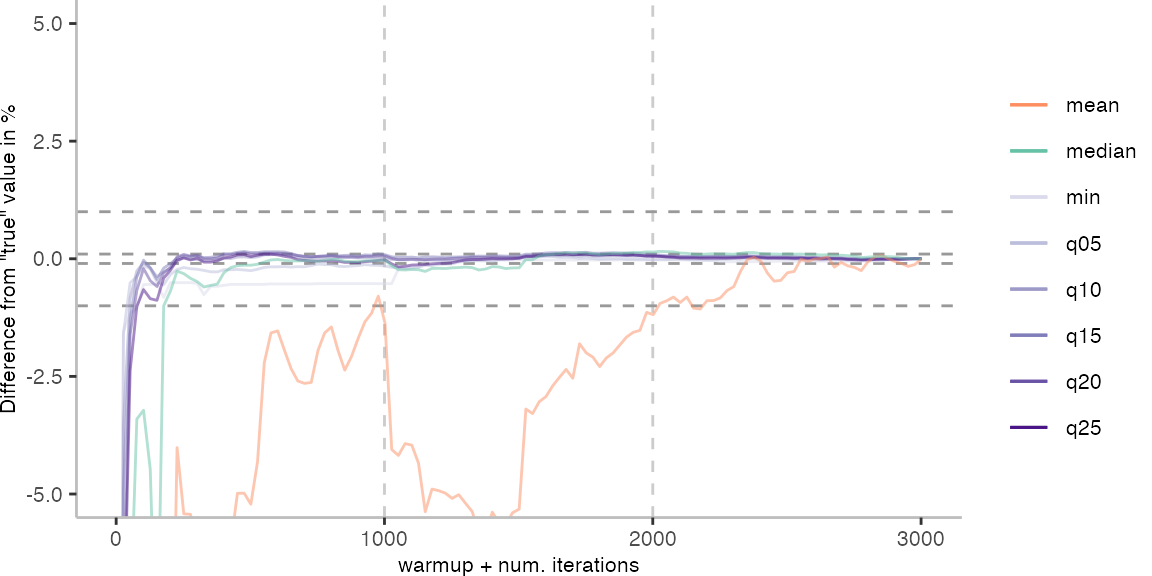
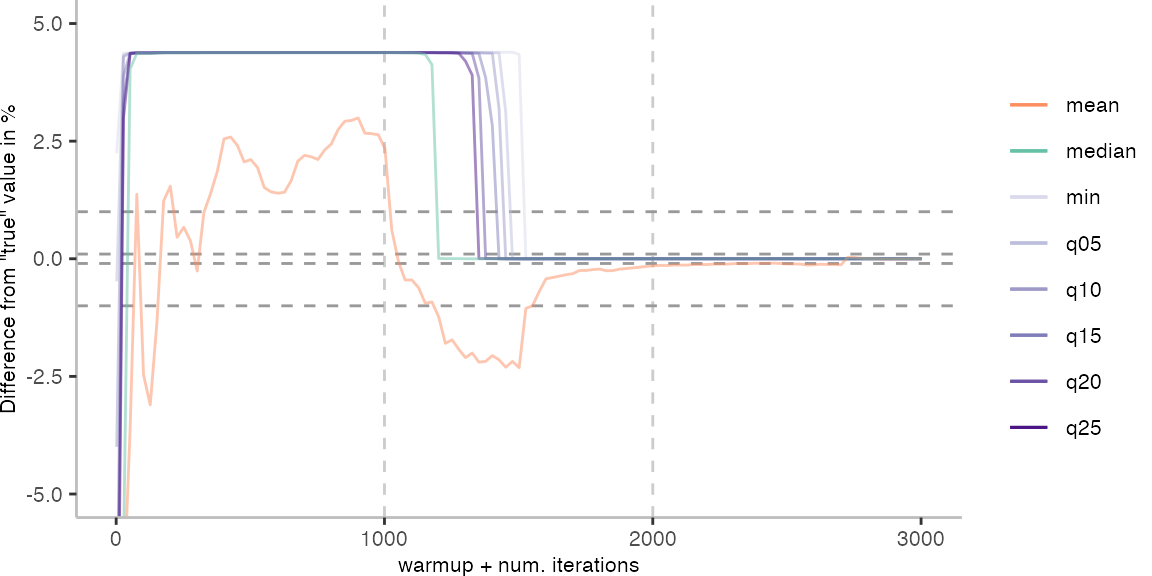
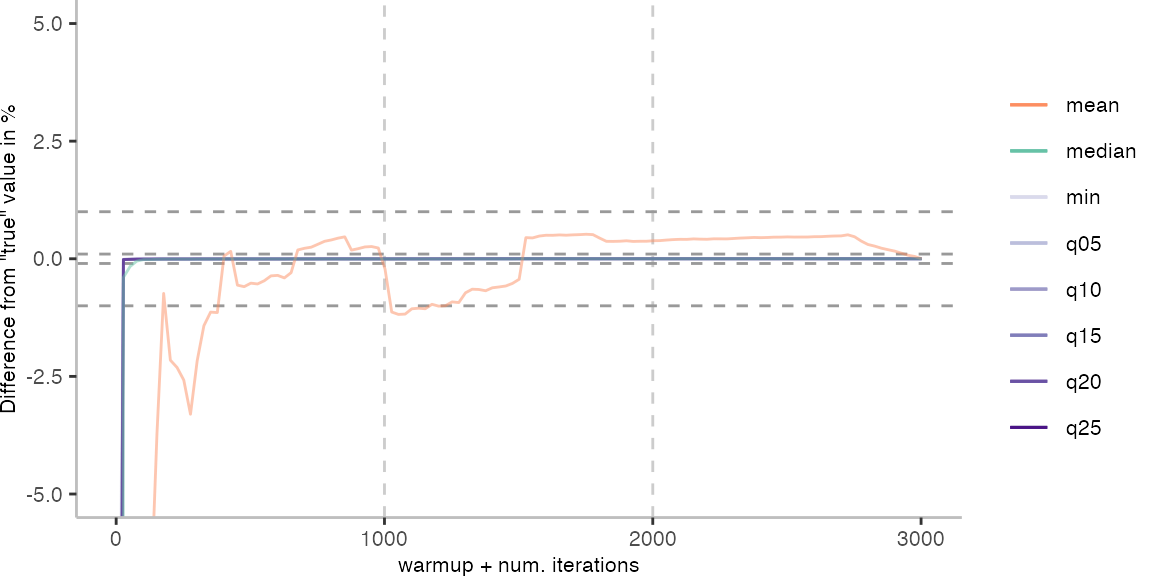
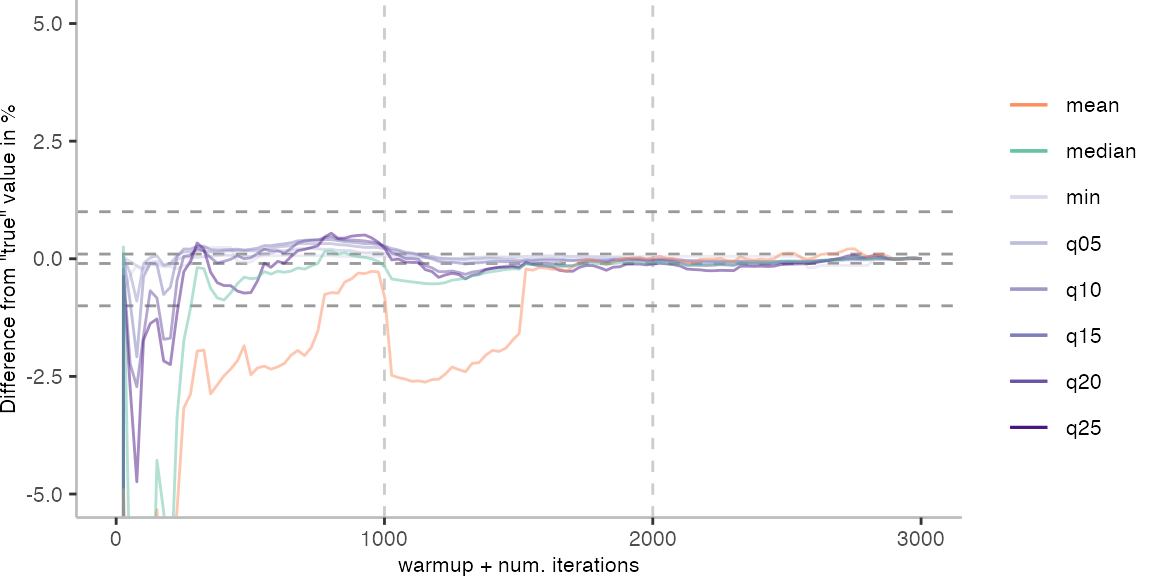
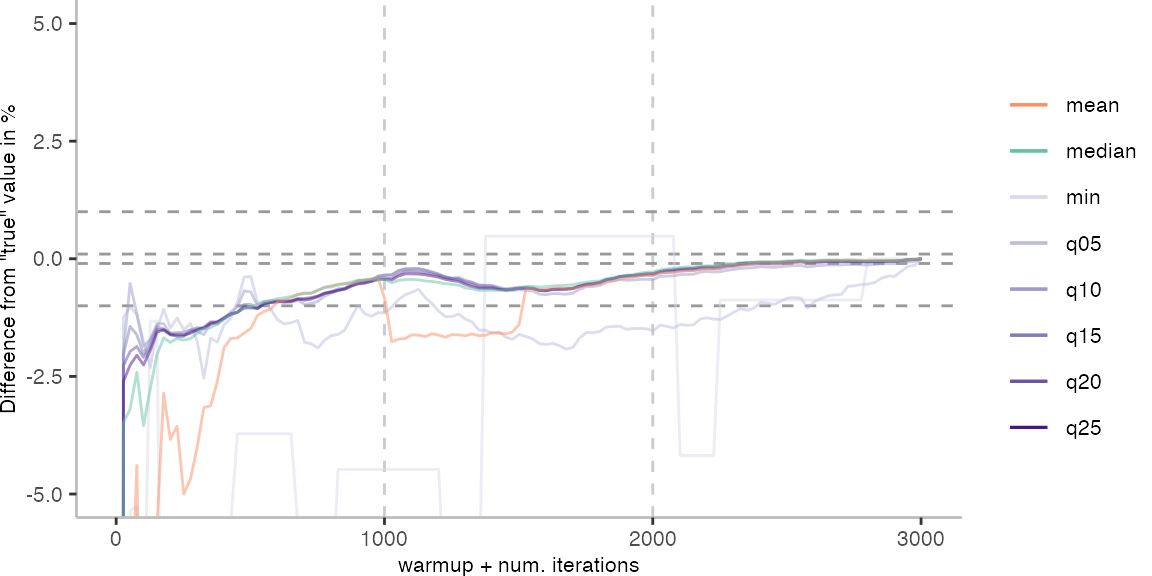
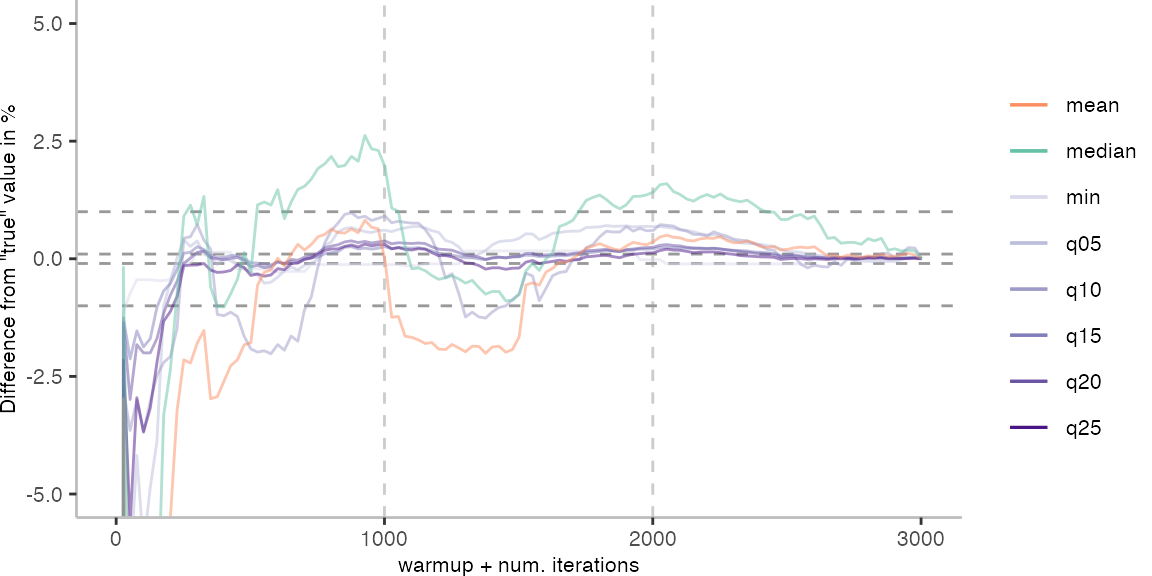
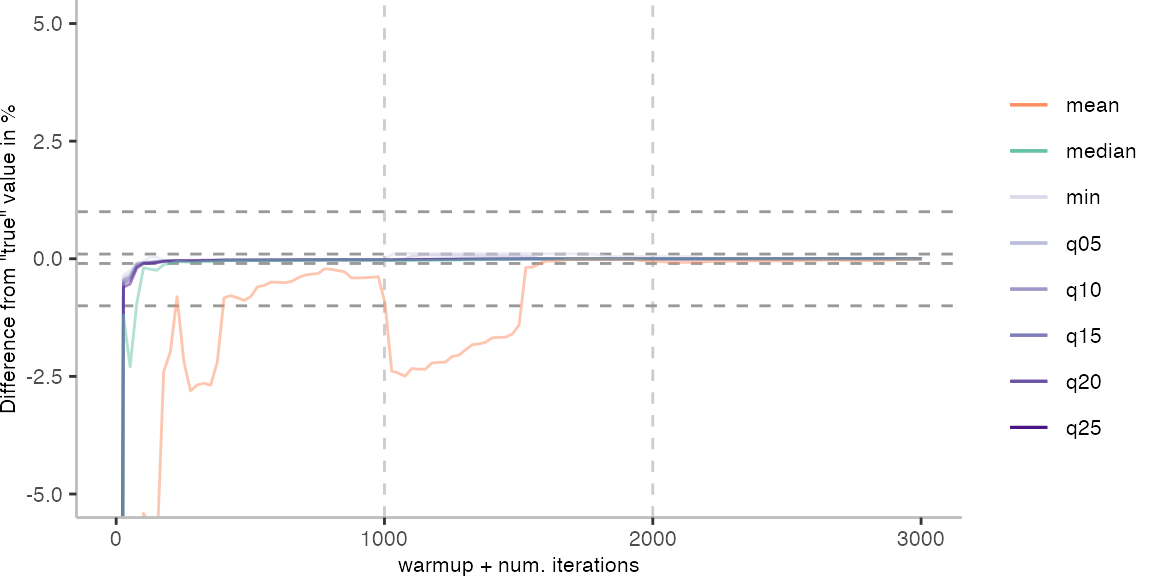
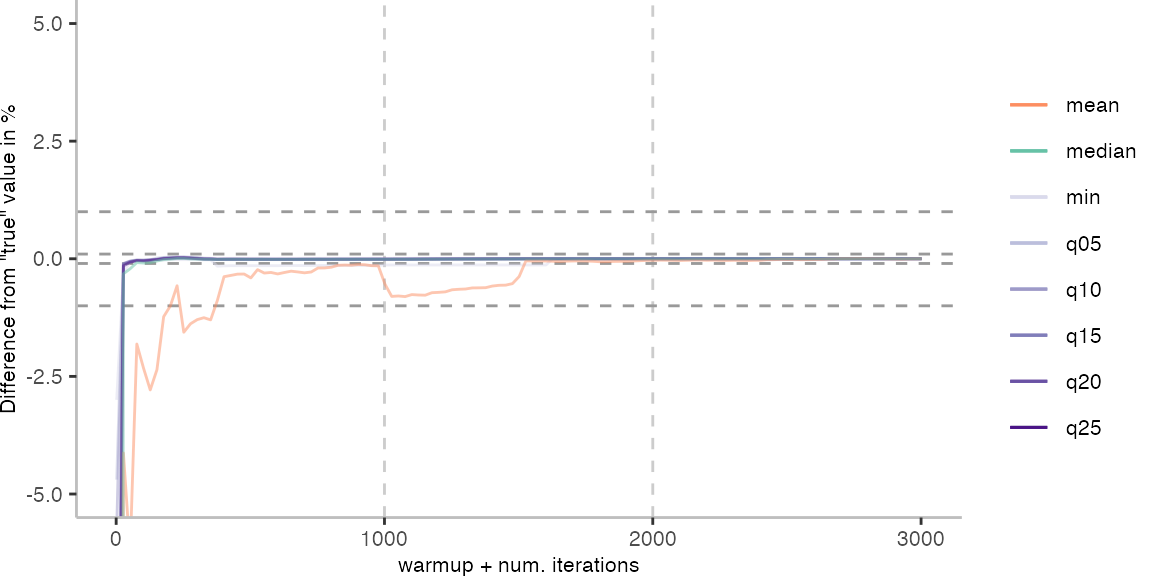
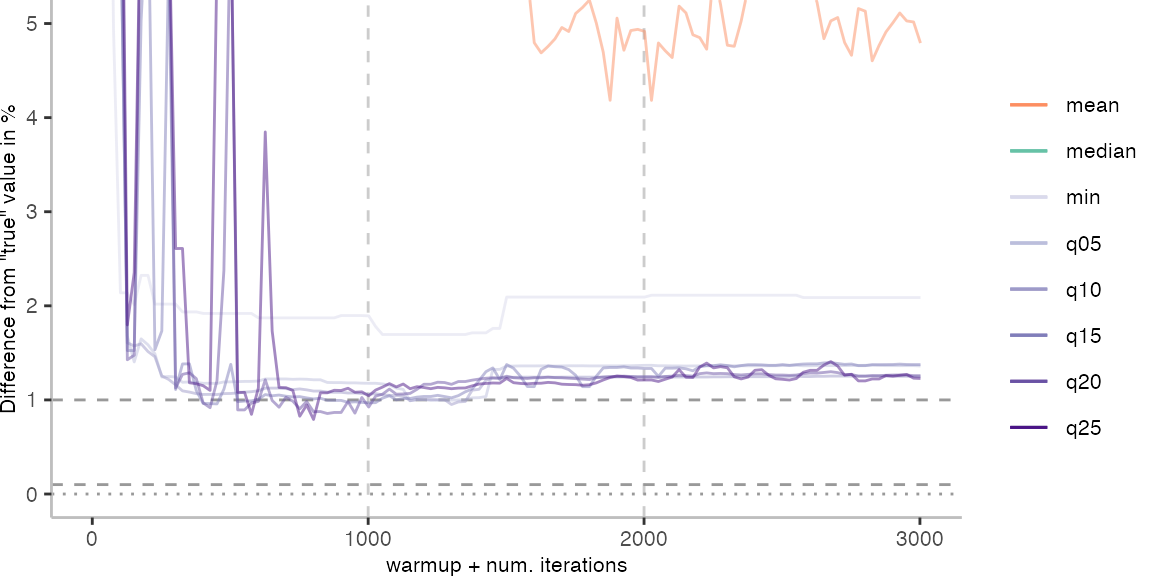
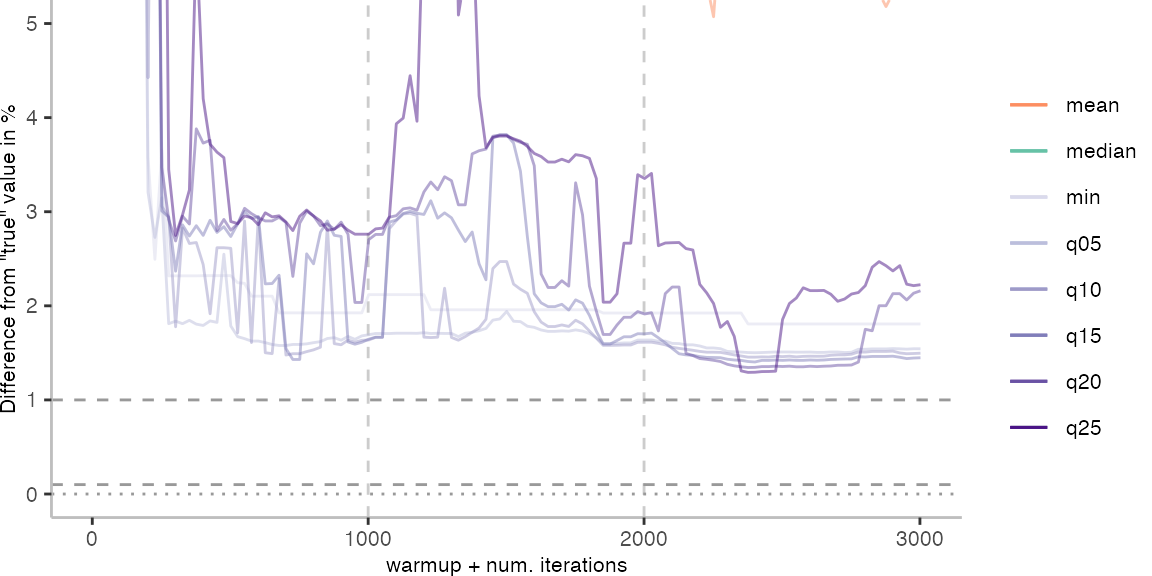
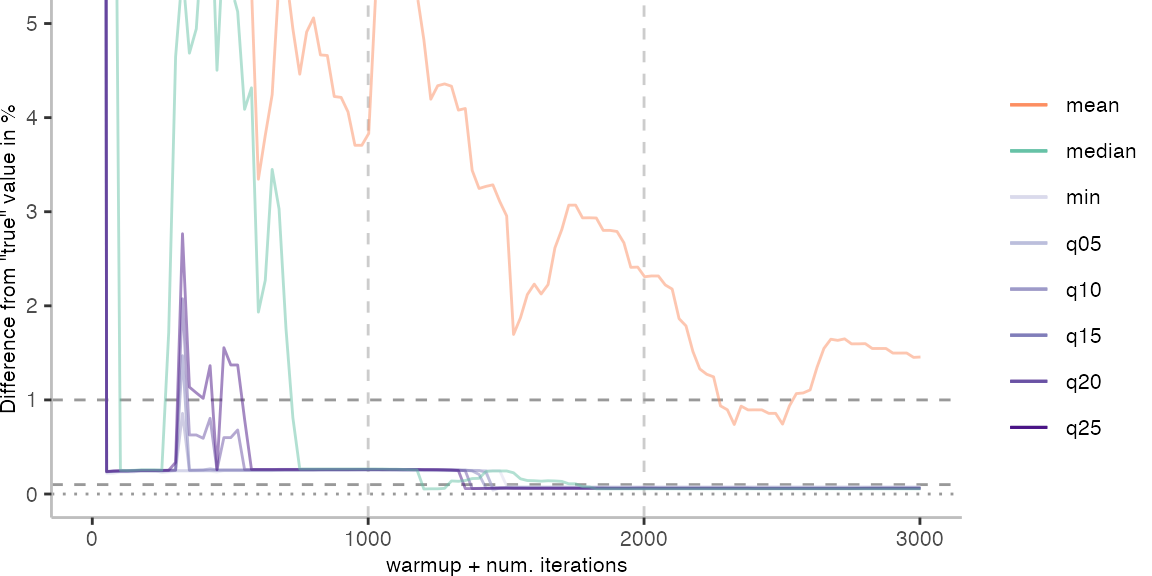
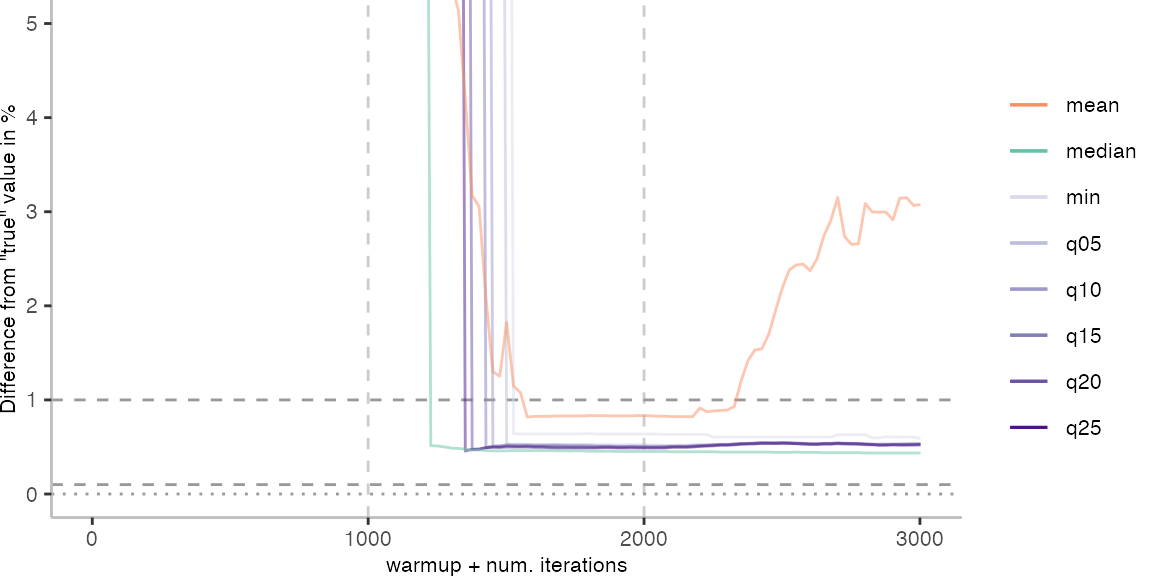
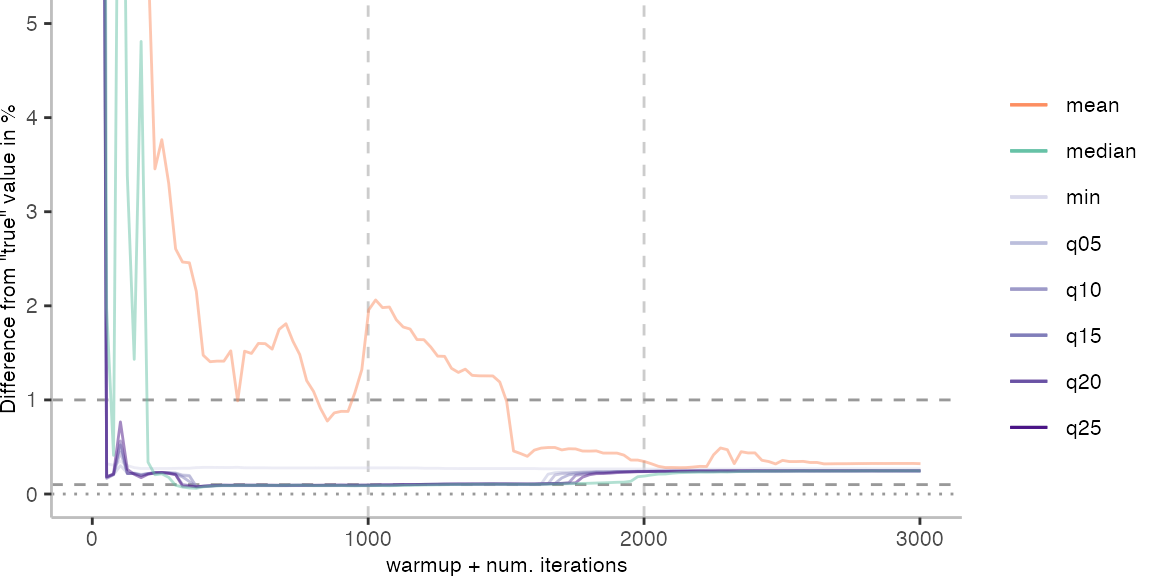
The above plots give use an idea of what it looks like when we use the data of 30 invocations. Though, realistically, this takes too long for day-to-day engineering. Below, I am going to look at how the metrics behave when we always pick the invocation with the largest difference from the “true” value.
For the IntegerLoop benchmark, things look fairly familiar. Though, the mean does seem to get worse with more data. The median seems to be the best metric of the lot, but stays well above the indicated 0.1% error margin.
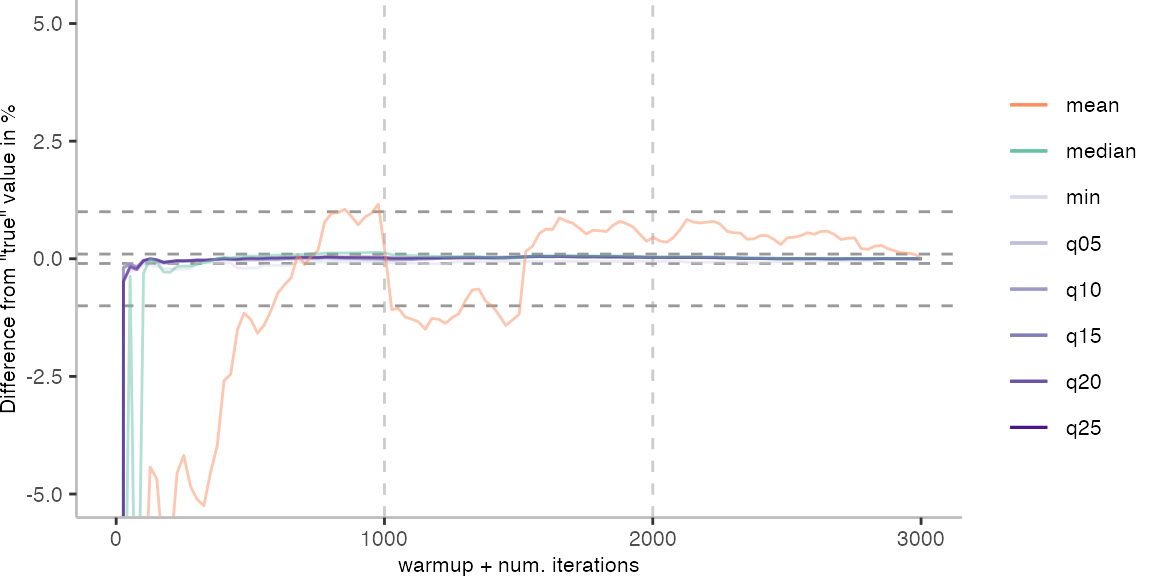
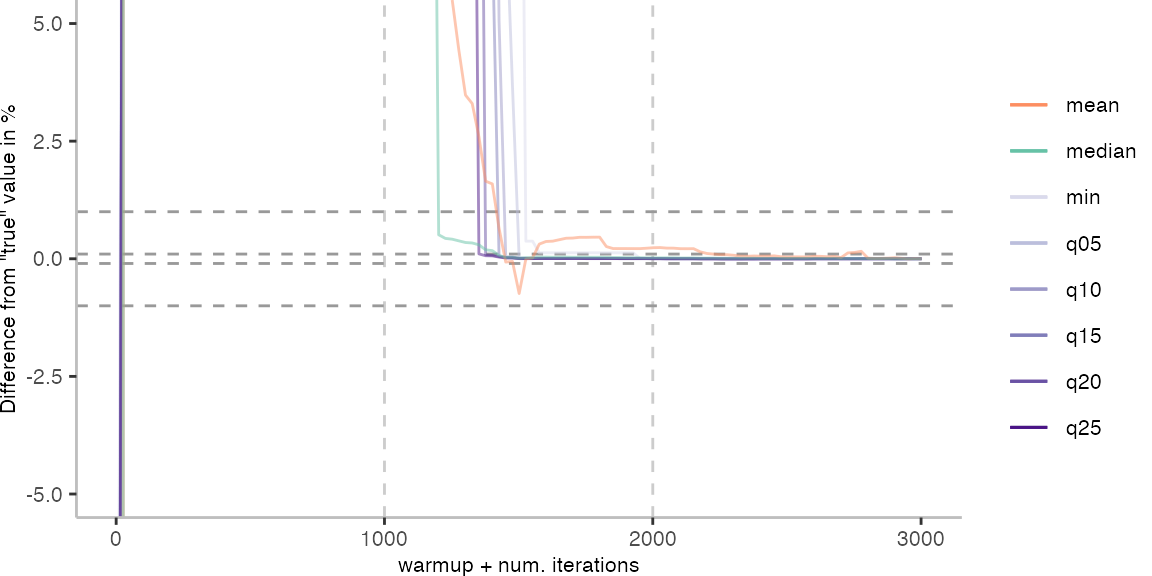
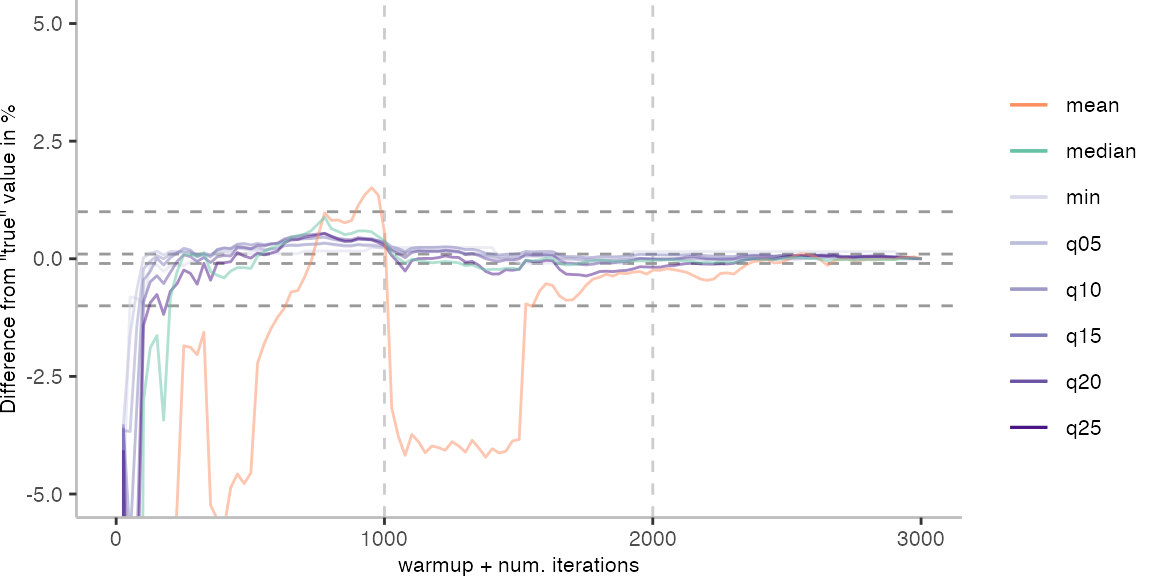
All Max. Difference Plots
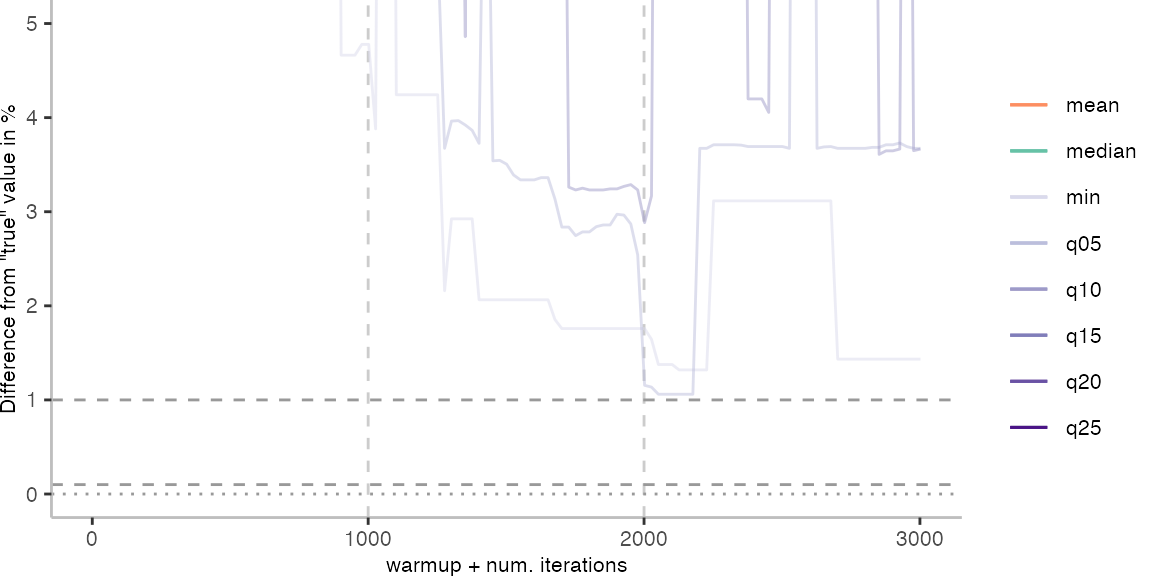
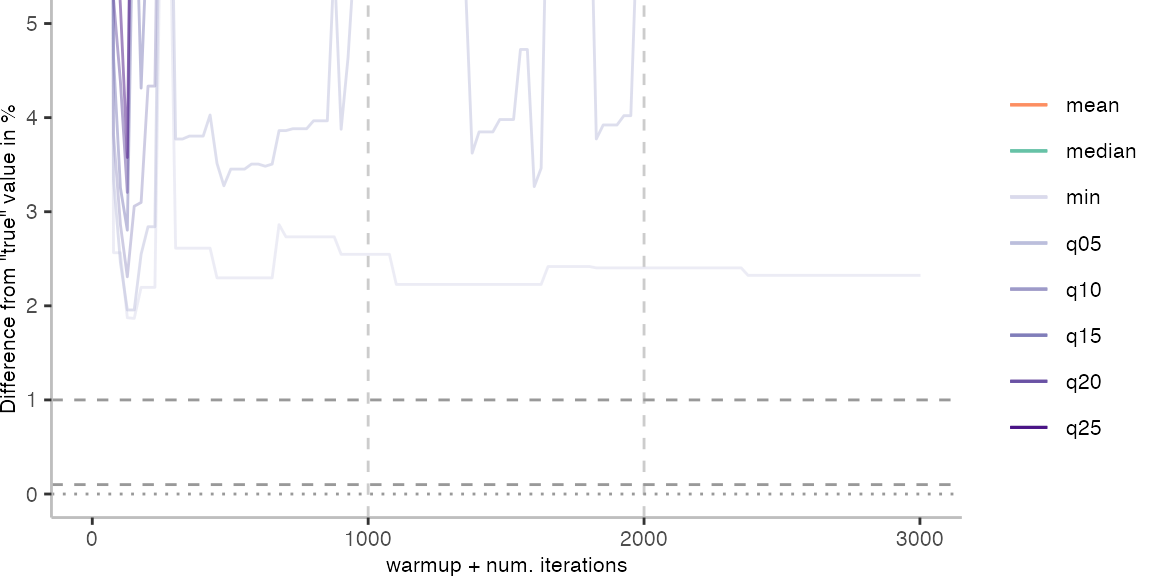
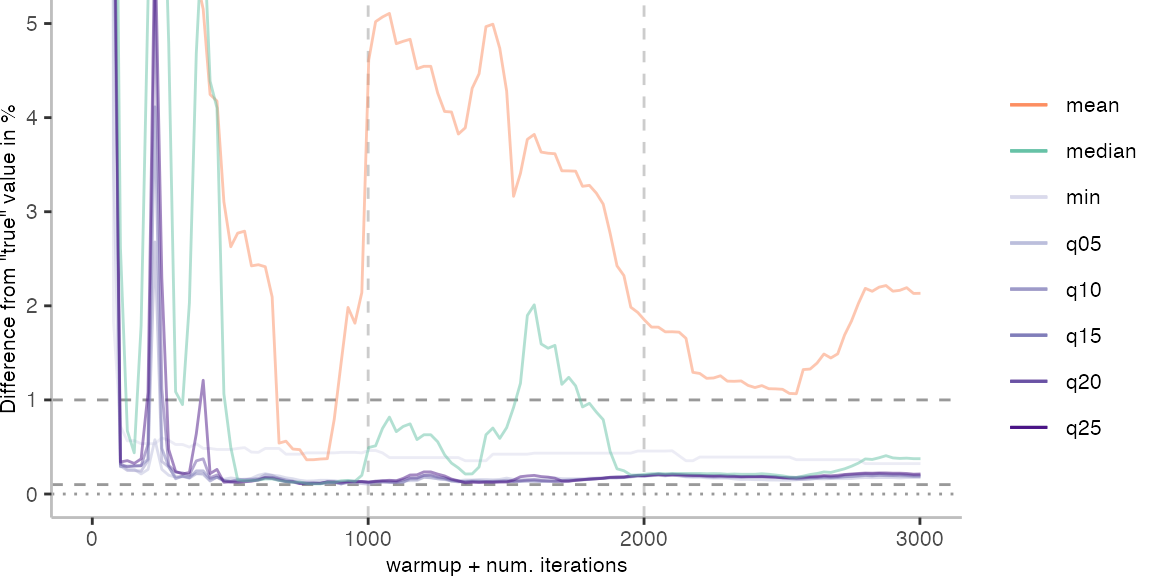
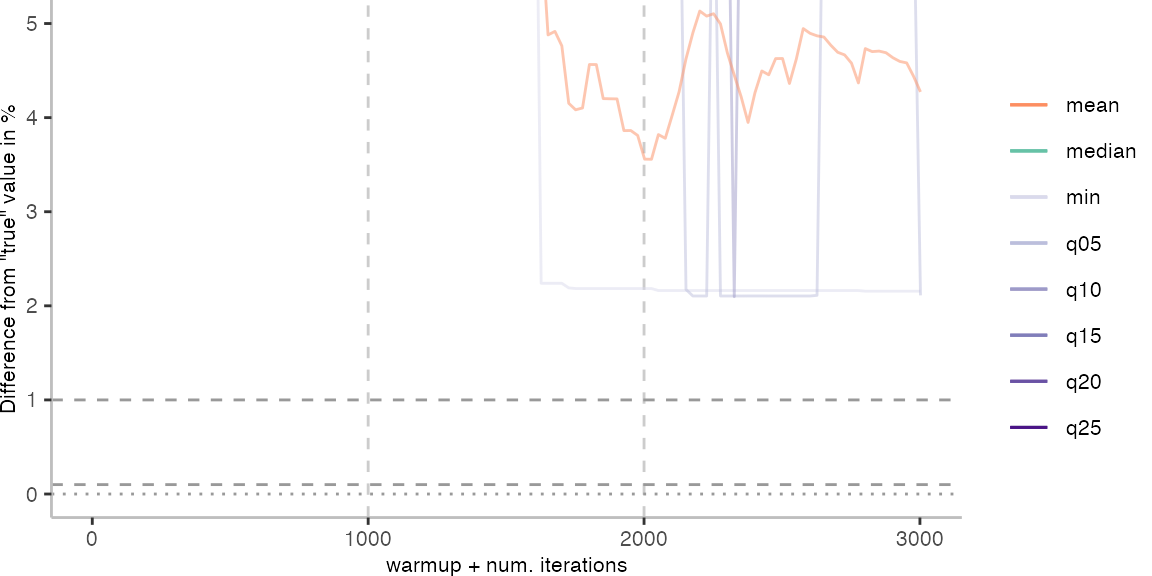
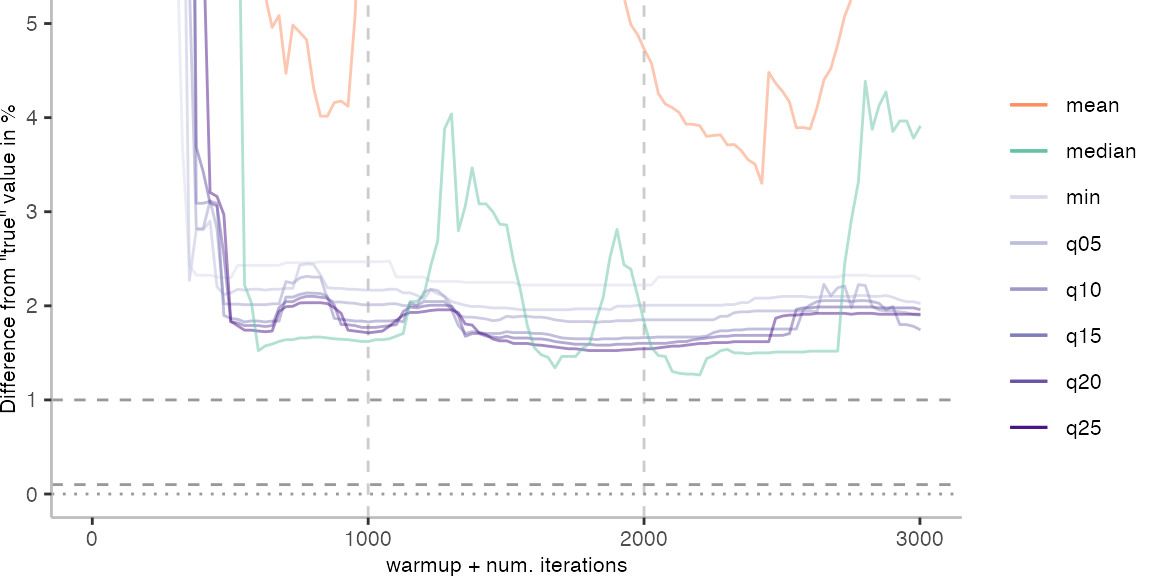


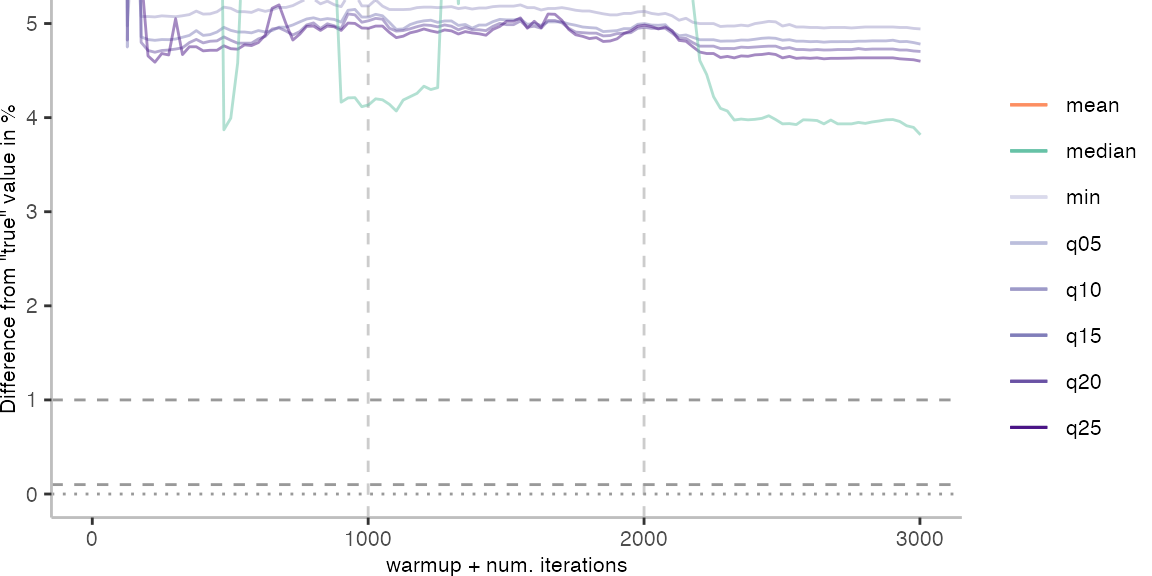
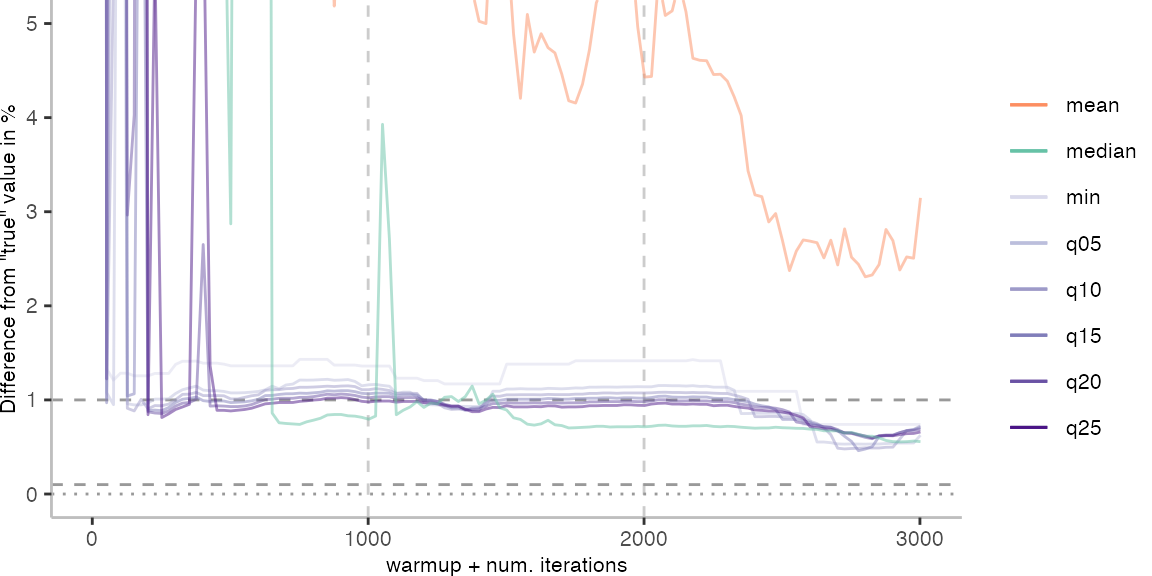

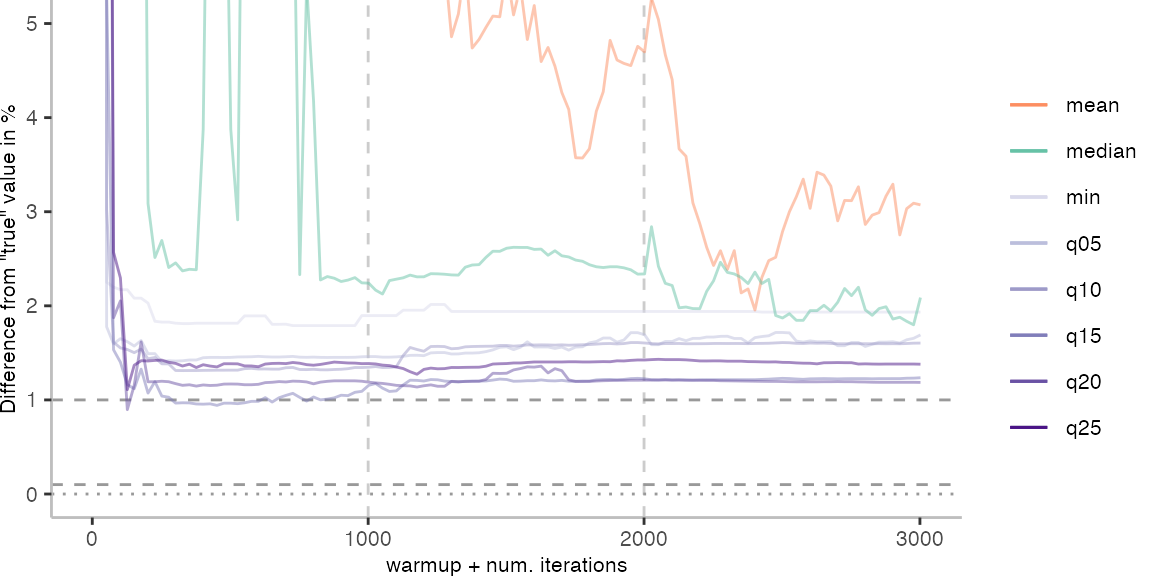
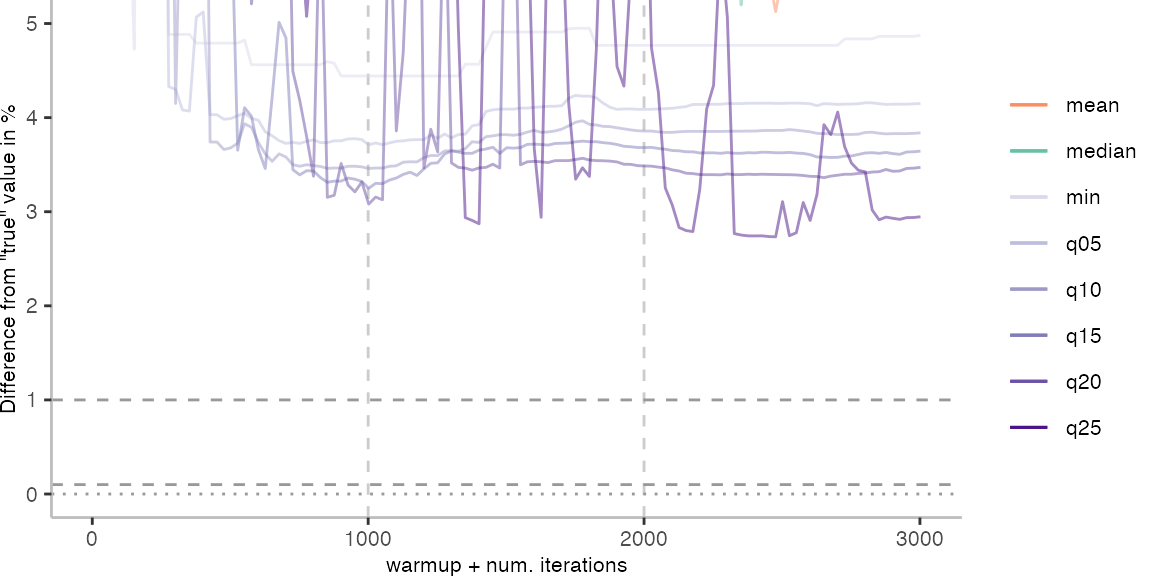
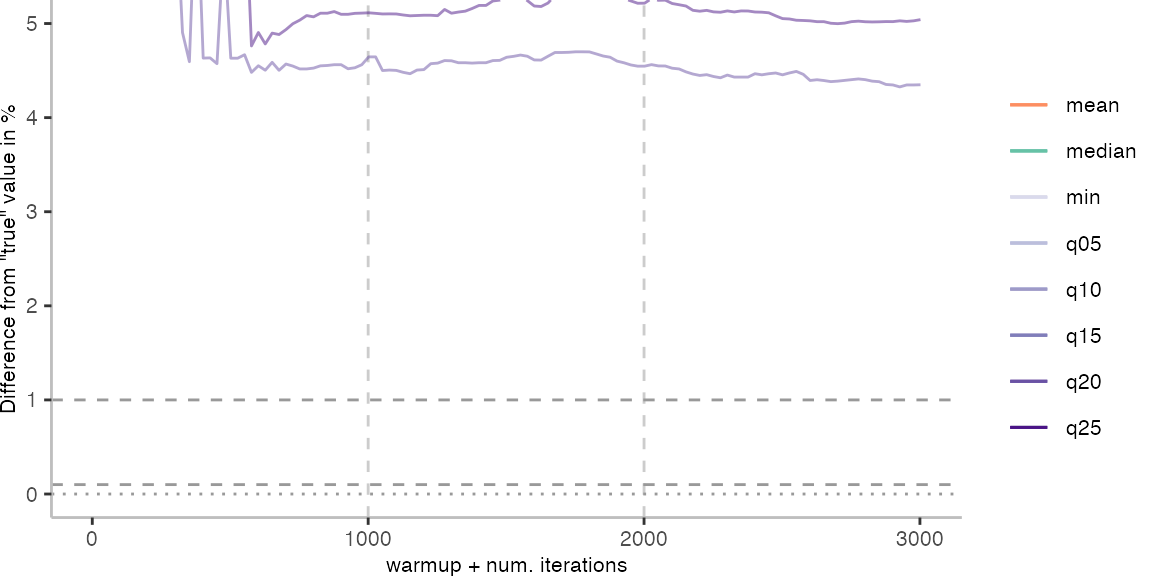

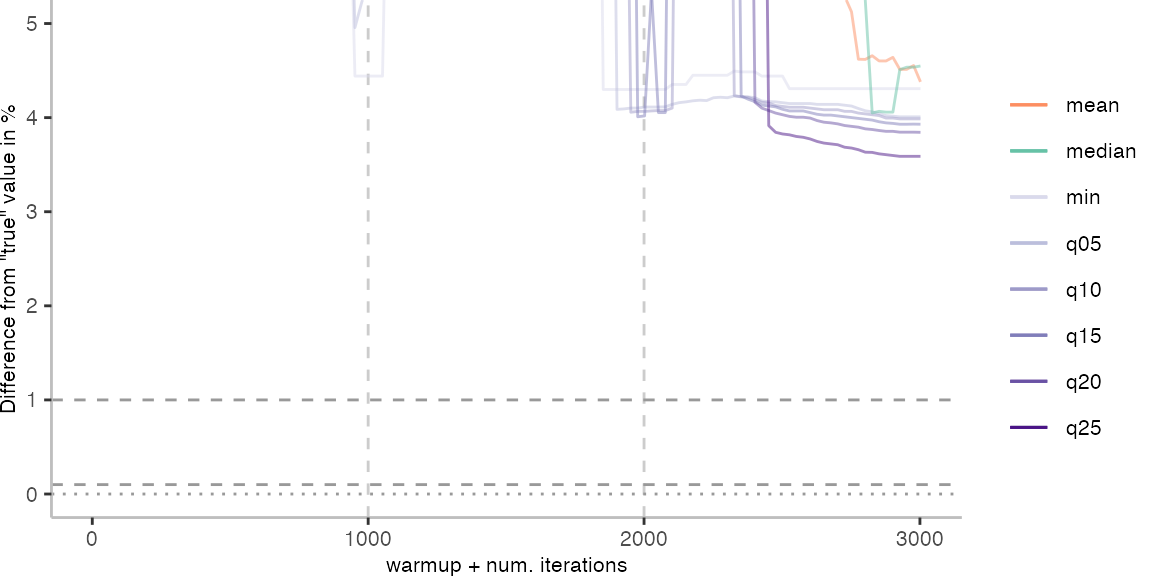

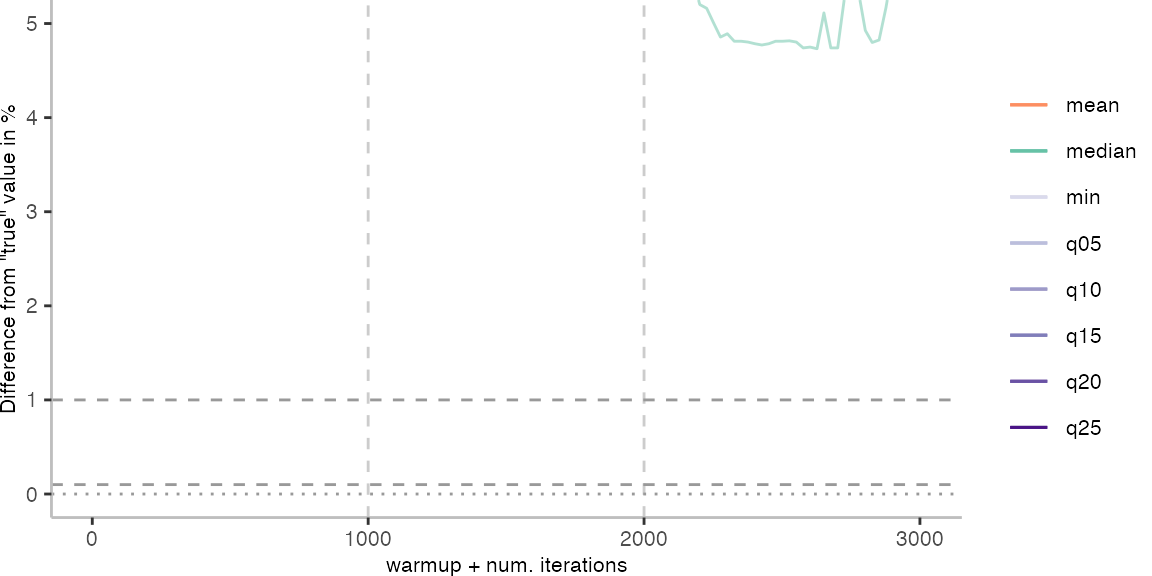


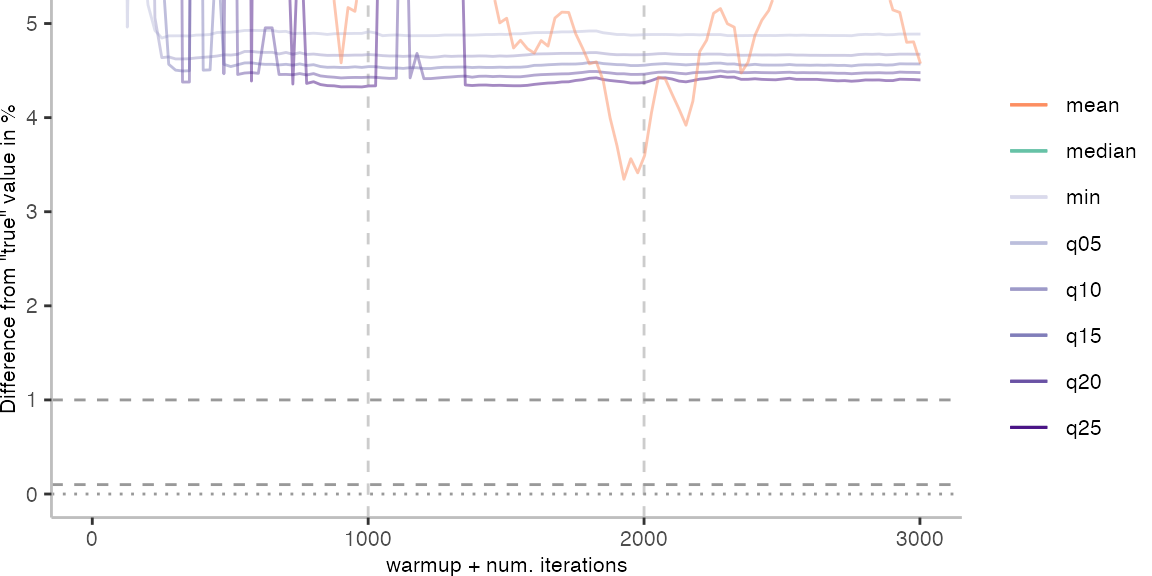
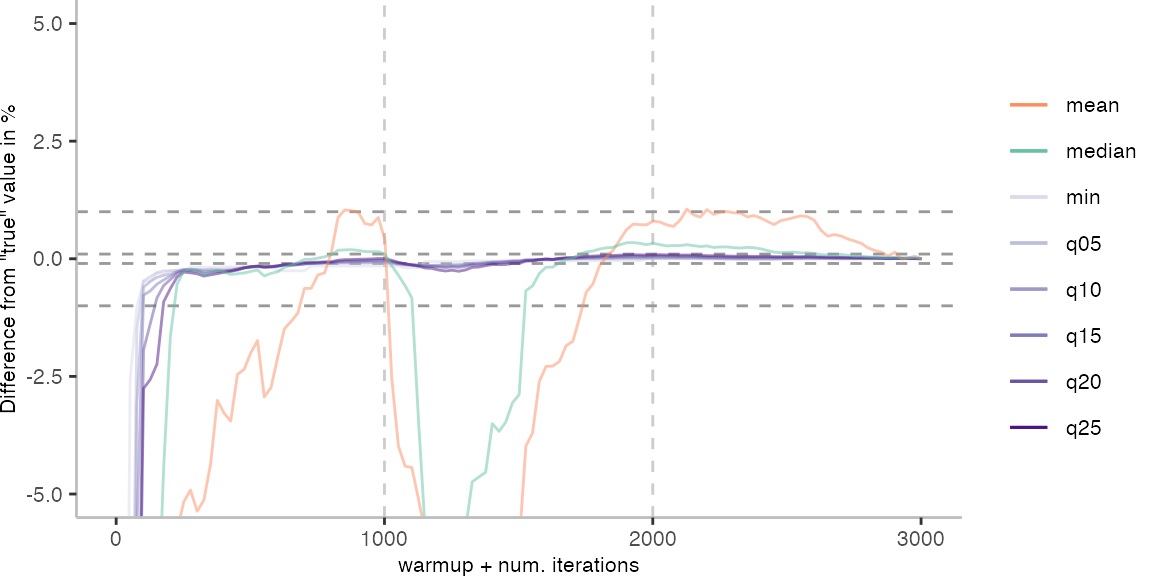
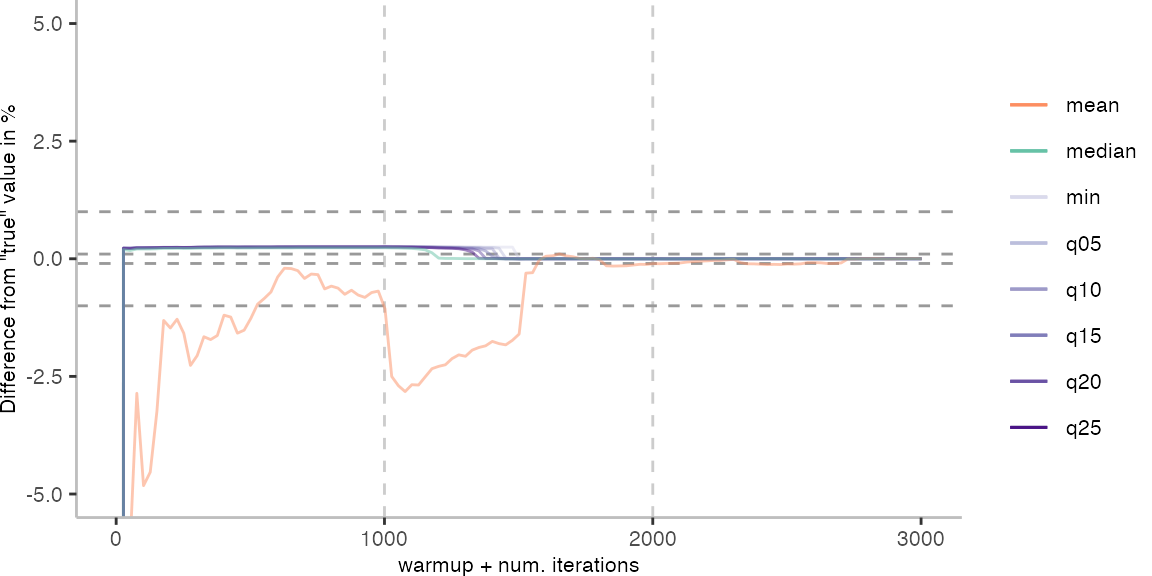
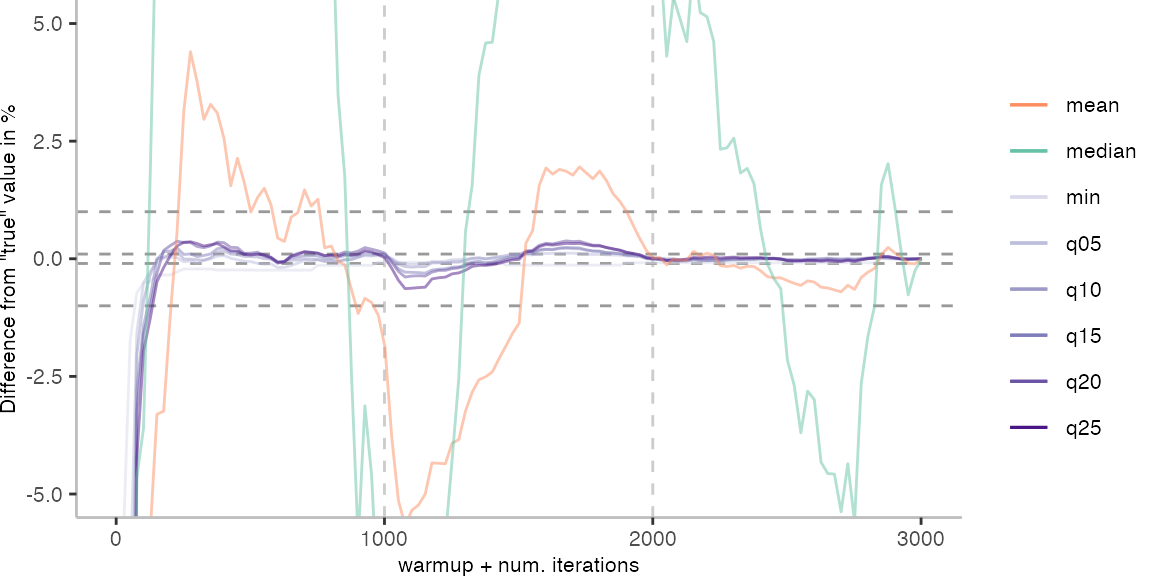
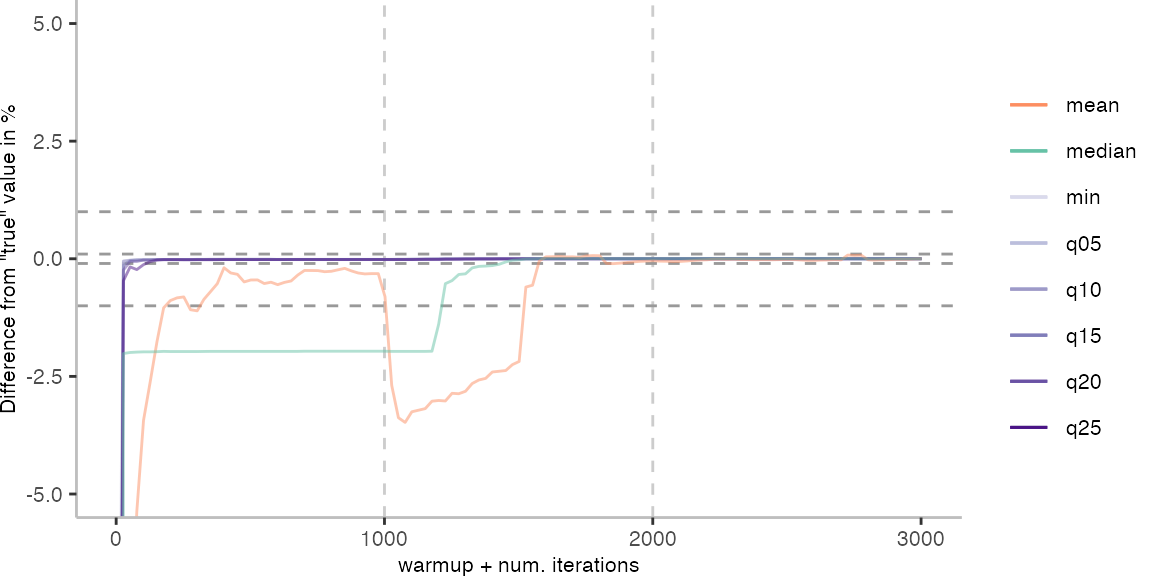
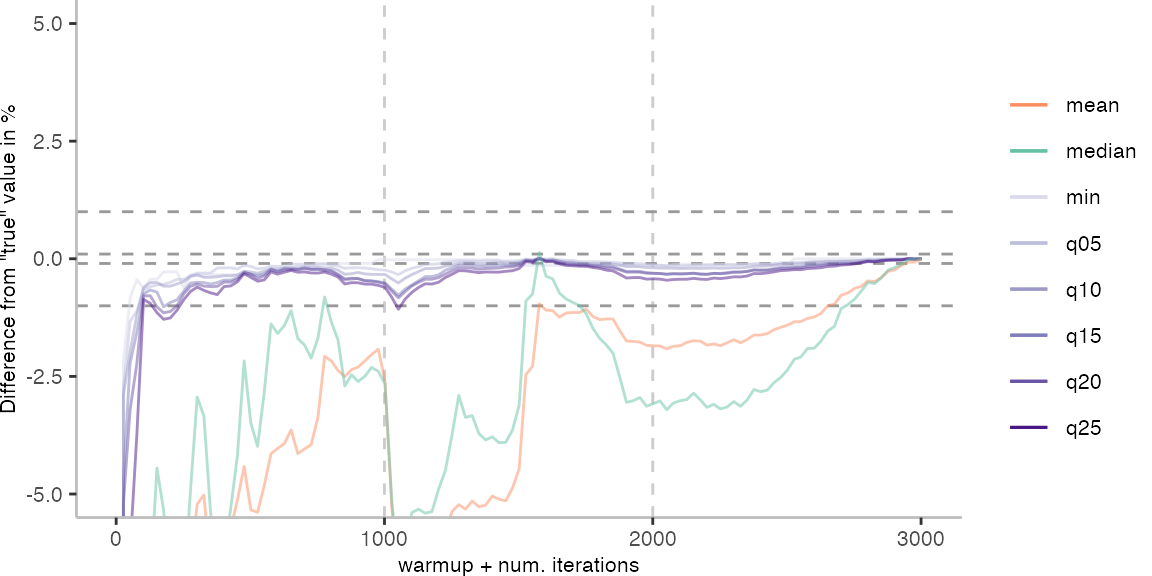
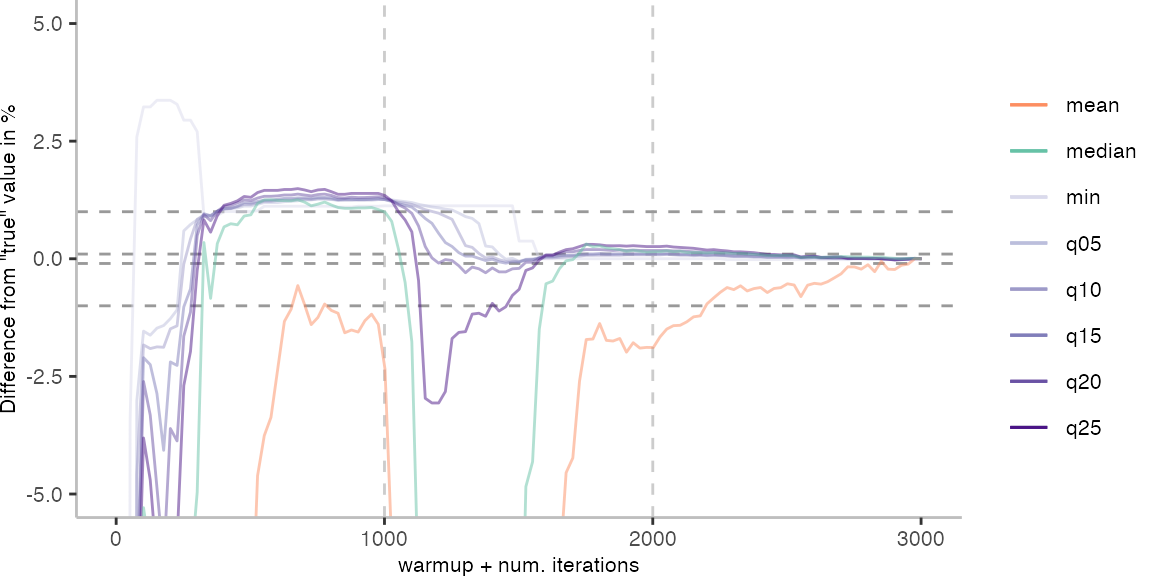
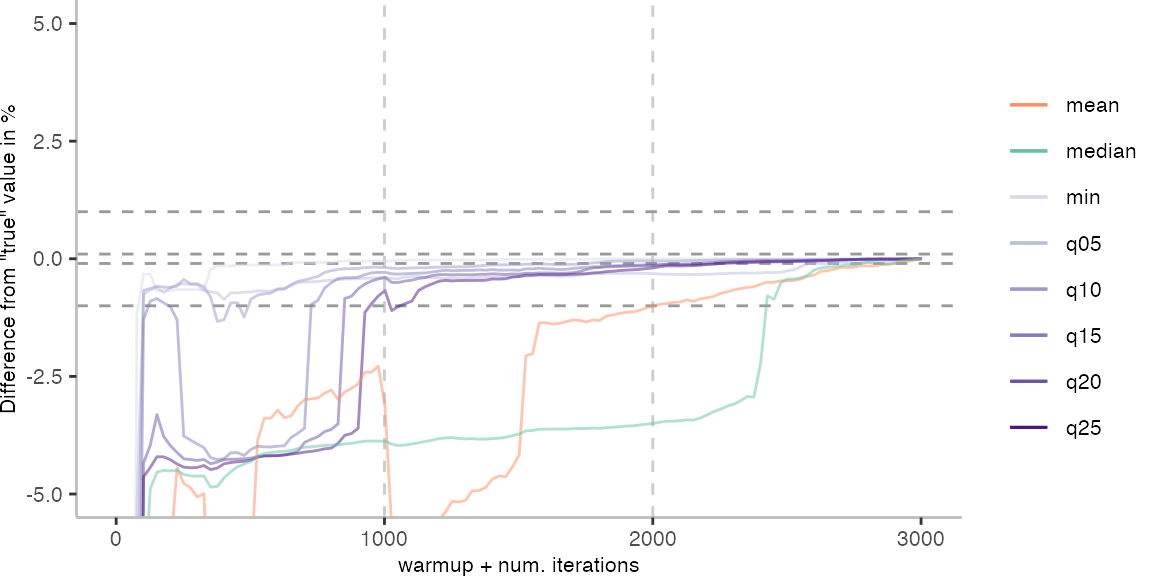
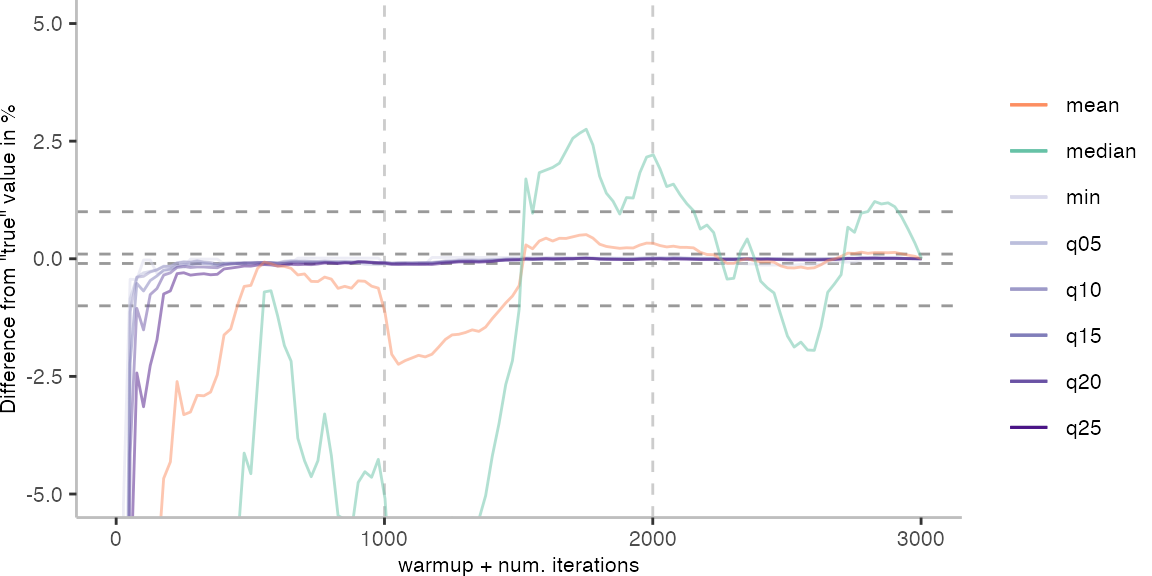
For the Vacation benchmark, the situation is quite a bit worse. We are getting nowhere near the accuracy that we would need. The error does barely reach 25%.
Looking at the plots for all benchmarks in the box on the right, doesn’t make me feel more joyous either. It’s bad.
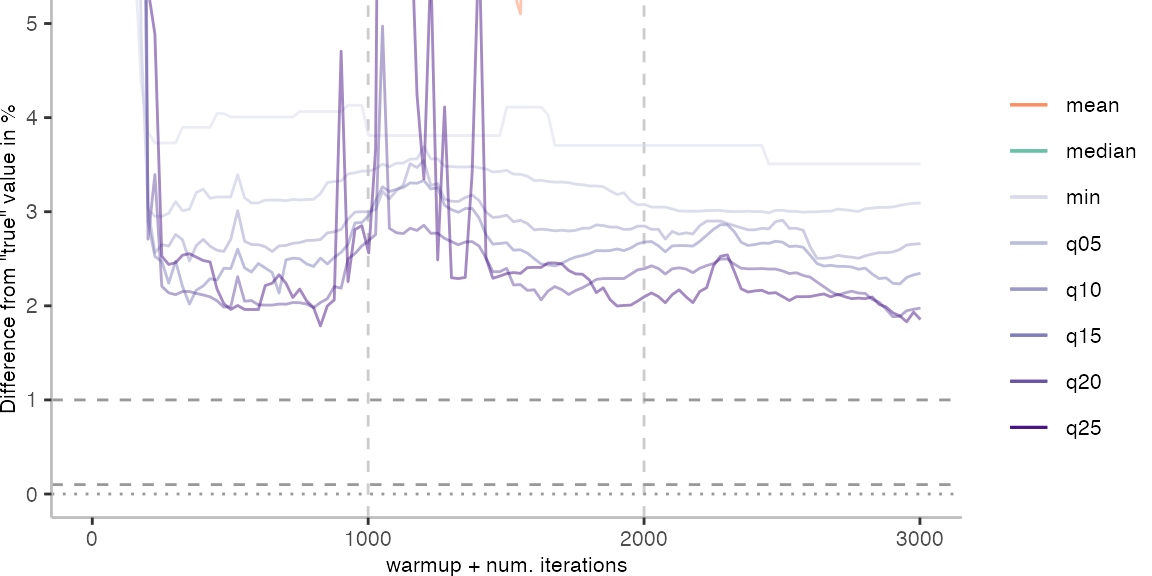
How Many Benchmarks Reach a Certain Accuracy?
With these plots, the next question coming to my mind is how many benchmarks actually reach a desired accuracy. So, for how many benchmarks is the difference to a “true” average within an allowed range.
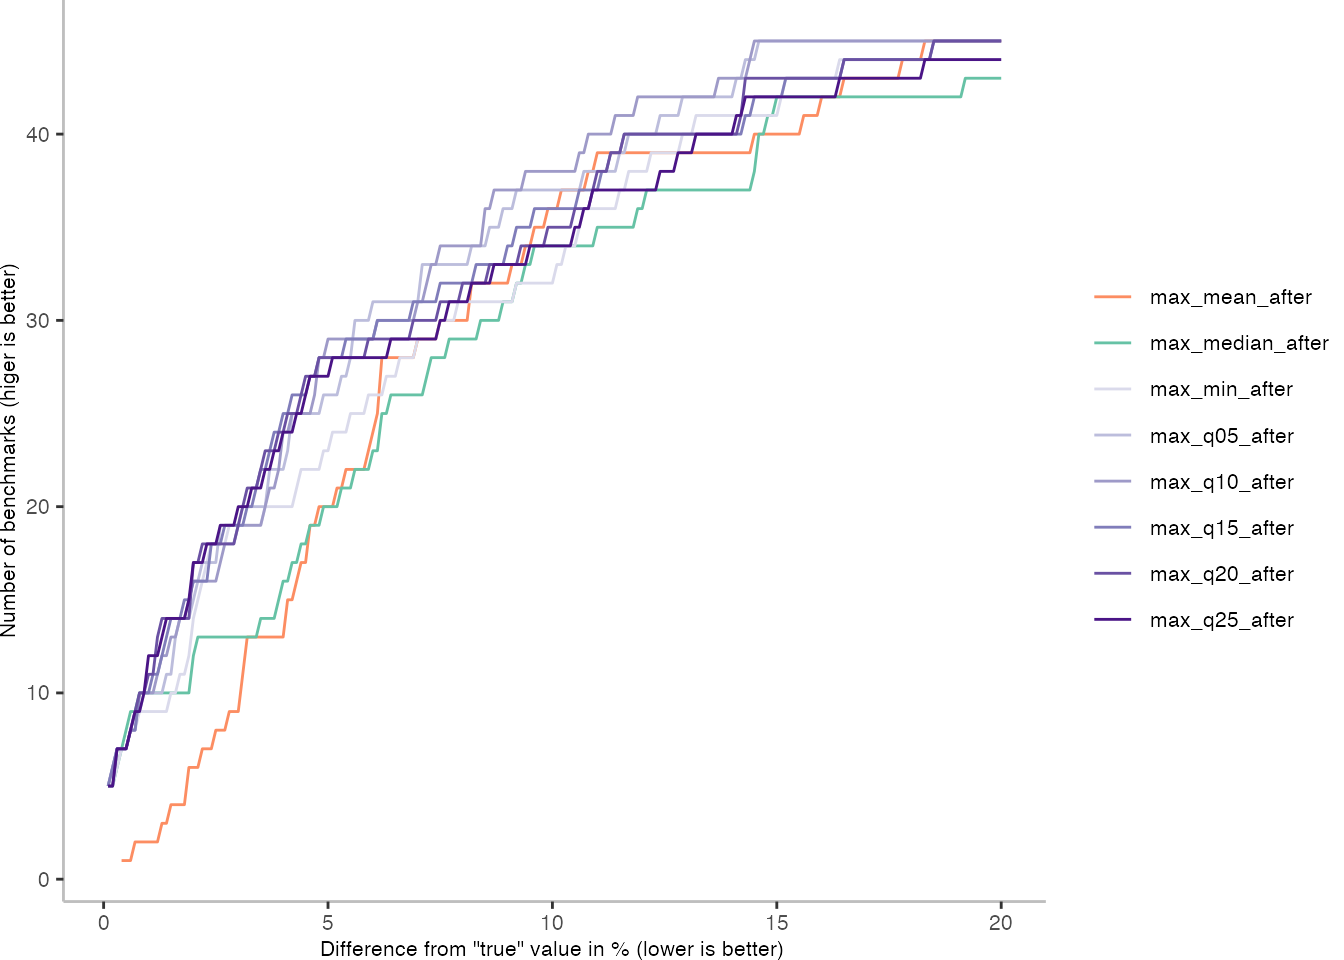
The plot below indicates again: it doesn’t look good. The 25th percentile seems to be have reasonably well and I’ll rely on it for the further discussion.
In total, there are 46 benchmarks. If we are optimistic, and allow merely an error of 0.1%, there are only 5 benchmarks that reach the goal using the 25th percentile as metric. With a 1% error, we get up to 12 benchmarks, and with 5% even 27.
Though this means there are a lot of benchmarks, for which the accuracy is not very practical. Even with a 5% fluctuation, I can’t really tell whether a small optimization in the language implementation has an impact on performance.
How Much Data Do We Need to Reach a Certain Accuracy?
To conclude the discussion for now, let’s look at how much data we need to reach a desired level of accuracy. Using the 25% percentile as before, I’ll determine the number of iterations that it takes (including warmup) before we reach a given degree of accuracy.
The table below shows the required iterations for a given accuracy. Benchmarks that aren’t listed, simply don’t reach the accuracy. For the ones that are listed, we can see that a lot of data is needed. Of course, this is still assuming we only use a single invocation for the benchmark. Thus, these numbers a derived from the maximum error between “true” value and one of the observed invocations.
| Benchmark | 0.1% | 0.2% | 0.3% | 0.4% | 0.5% | 0.6% | 0.7% | 0.8% | 0.9% | 1% | 1.1% | 1.2% | 1.3% | 1.4% | 1.5% | 1.6% | 1.7% | 1.8% | 1.9% | 2% | 2.1% | 2.2% | 2.3% | 2.4% | 2.5% |
|---|---|---|---|---|---|---|---|---|---|---|---|---|---|---|---|---|---|---|---|---|---|---|---|---|---|
| Dispatch | 1352 | 1352 | 1352 | 1352 | 1352 | 1352 | 1352 | 1352 | 1352 | 1352 | 1352 | 1352 | 1352 | 1352 | 1352 | 1352 | 1352 | 1352 | 1352 | 1352 | 1352 | 1352 | 1352 | 1352 | 1352 |
| FieldLoop | 1352 | 1352 | 1352 | 1352 | 1352 | 1352 | 1352 | 1352 | 1352 | 1352 | 1352 | 1352 | 1352 | 1352 | 1352 | 1352 | 1352 | 1352 | 1352 | 1352 | 1352 | 1352 | 1352 | 1352 | 1352 |
| Mandelbrot | 1352 | 1352 | 577 | 577 | 577 | 577 | 577 | 552 | 552 | 552 | 552 | 552 | 552 | 502 | 502 | 352 | 352 | 352 | 352 | 352 | 352 | 352 | 352 | 352 | 352 |
| ProducerConsumerBoundedBuffer | 1052 | 502 | 477 | 277 | 277 | 277 | 277 | 277 | 227 | 227 | 177 | 77 | 77 | 77 | 77 | 77 | 77 | 77 | 77 | 77 | 77 | 52 | 52 | 52 | 52 |
| Sum | 777 | 777 | 777 | 777 | 777 | 777 | 777 | 777 | 302 | 302 | 302 | 302 | 302 | 302 | 302 | 227 | 227 | 227 | 227 | 227 | 202 | 202 | 202 | 202 | 202 |
| NBody | 427 | 427 | 427 | 427 | 427 | 427 | 427 | 427 | 427 | 427 | 277 | 277 | 277 | 277 | 277 | 277 | 277 | 277 | 277 | 277 | 252 | 252 | 252 | ||
| TrapezoidalApproximation | 127 | 127 | 127 | 127 | 127 | 52 | 52 | 52 | 52 | 52 | 52 | 52 | 52 | 52 | 52 | 52 | 52 | 52 | 52 | 52 | 52 | 52 | 52 | ||
| IntegerLoop | 1352 | 1352 | 1352 | 1352 | 1352 | 1352 | 1352 | 1352 | 1352 | 1352 | 1352 | 1352 | 1352 | 1352 | 1352 | 1352 | 1352 | 1352 | 1352 | 1352 | |||||
| ClosureFibonacci | 2652 | 2602 | 2402 | 977 | 452 | 452 | 452 | 427 | 427 | 427 | 427 | 427 | 427 | 427 | 427 | 427 | 427 | 427 | 427 | ||||||
| Lee | 1702 | 1652 | 1602 | 1602 | 1527 | 1527 | 1527 | 1502 | 1502 | 1427 | 1427 | 1402 | 1402 | 1402 | 1402 | 1402 | 1377 | ||||||||
| ConcurrentSortedLinkedList | 2952 | 2852 | 2802 | 2777 | 2627 | 2602 | 1702 | 1452 | 1402 | 1402 | 1377 | 1377 | 502 | 452 | 452 | 402 | |||||||||
| NQueens | 2702 | 2702 | 2702 | 2702 | 2702 | 2702 | 2702 | 2702 | 2702 | 2702 | 2702 | 2702 | 2702 | 2702 | 2702 | 2702 | |||||||||
| CD | 2727 | 2702 | 677 | 677 | 677 | 652 | 652 | 652 | 652 | 652 | 652 | 652 | 652 | ||||||||||||
| Recurse | 2502 | 127 | 127 | 127 | 127 | 127 | 127 | 127 | 127 | 102 | 102 | 102 | |||||||||||||
| Splay | 3002 | 2877 | 2727 | 2352 | 2352 | 2327 | 2327 | ||||||||||||||||||
| RichardsNS | 877 | 502 | 502 | 502 | 502 | 502 | |||||||||||||||||||
| WhileLoop | 1452 | 1277 | 1277 | 852 | 852 | 852 | |||||||||||||||||||
| Havlak | 2952 | 2952 | 2202 |
Further Reading
This analysis isn’t done in a vacuum of course. Proper benchmarking and evaluation are an important topic in literature, especially when it comes to reporting results in academic papers. Georges at al. (2007) have long advocated for using statistically rigorous methods for evaluating just-in-time compiled systems. Their proposed methodology includes to take the mean per invocation for the iterations after a certain warmup cut off. Though, they use also confidence intervals and the coefficient of variance, which I haven’t done here. Interestingly they report a maximum difference of 20% between the minimum and maximum for benchmarks at peak performance. The benchmarks I am using on SOMns seem to show higher differences. Georges at al. also provided JavaStat, a tool to automatically determine the necessary number of benchmark iterations to reach a desired confidence interval width.
Kalibera and Jones (2013) expand on the work by investigating how to do rigorous benchmarks in reasonable time. They advocate for the use of effect size confidence intervals as well as a visual approach to determine that measurements are independent of each other. They also look at the variation between invocations, which at least for one benchmark was 30%. This lead them to propose a way to determine how many iterations and invocations one would need to achieve a desired precision. In an earlier paper they went into the underlying technical details.
More recently, Barrett et al. looked into one of the underlying assumptions we typically have: we hope our systems reach a steady state. Spoiler: they often don’t. They use Krun to control the system on which the benchmarks are executed to minimize interference coming from the operating system and hardware. The work concludes with useful suggestions about sizing experiments, similar to what Kalibera and Jones did. They suggest to use at the very least 10 invocations, where 15 should give reliable results.
Bulej et al. (2020) investigate how to benchmark in noisy environments such as multitenant cloud servers. They propose an approach that carefully synchronizes the execution of the pairs of systems to be compared. This seems to reduce the size of their bootstrap confidence intervals significantly.
What’s Next?
The aforementioned literature lays a foundation for statistically rigorous work. I have been adhering to at least some of the suggestions to ensure reliable results in my own papers. However, none of these approaches help me with my day-to-day engineering needs. Even doing 5 or 10 invocations for each benchmark result in overall run times of the benchmarking job that make them too slow for good usability.
From the data it is evident that the compilation threshold is clearly observable. The first step will be to reduce it and hope that this will lead to better results. A very quick and dirty run with the benchmarking settings I have been using didn’t indicate any significant improvements, but a full run is still in progress.
Another knob to be turned are the benchmark parameters. Benchmarks such as Vacation have very short iteration times, which makes them susceptible to noise.
And, then, there are the strange things, for instance with IntegerLoop, which need to be investigated, and possibly reveal engineering issues.
Since SOMns uses Truffle and Graal, using libgraal may further improve things. It would hopefully avoid interference from the compiler being compiled at run time. Similarly, perhaps there are a few simple things to be stolen from Krun that could reduce the environmental noise.
And there are probably, a hundred other things I could try.
If you got suggestions, tips and tricks, comments, questions, or complains, you can find me over on Twitter @smarr.