<?xml version="1.0" encoding="utf-8"?><feed xmlns="http://www.w3.org/2005/Atom" ><generator uri="https://jekyllrb.com/" version="4.4.1">Jekyll</generator><link href="https://stefan-marr.de/feed/index.xml" rel="self" type="application/atom+xml" /><link href="https://stefan-marr.de/" rel="alternate" type="text/html" /><updated>2026-08-21T14:34:58+02:00</updated><id>https://stefan-marr.de/feed/index.xml</id><title type="html">Stefan-Marr.de</title><subtitle>personal and research notes
</subtitle><entry><title type="html">Pitfalls of Benchmarking on Modern Systems</title><link href="https://stefan-marr.de/2026/08/pitfalls-of-benchmarking-on-modern-systems/" rel="alternate" type="text/html" title="Pitfalls of Benchmarking on Modern Systems" /><published>2026-08-20T10:37:47+02:00</published><updated>2026-08-20T10:37:47+02:00</updated><id>https://stefan-marr.de/2026/08/pitfalls-of-benchmarking-on-modern-systems</id><content type="html" xml:base="https://stefan-marr.de/2026/08/pitfalls-of-benchmarking-on-modern-systems/"><![CDATA[<p>Modern computer systems are quite fascinating.
They are highly complex, run a lot of software, and their performance characteristics are hard or impossible to predict.</p>

<p>Earlier this year, I gave a lecture on benchmarking,
which for lack of generic and always-applicable advice,
I started with a brainstorming session
about its pitfalls.
Since systems have become so complex that we rarely know what happens exactly.
We are prone to simply guess what’s going on.
Or rather, we should hypothesize and verify our hypothesis.
Still, there might be many more causes for what we see than we can initially think of.</p>

<p>To illustrate this, I’ll use some fictitious benchmark results,
which are fairly close to what one would see in reality,
and there are usually many possible explanations
for the observed behavior.
This often means, only once we know what caused a specific artifact,
we can make progress with <em>understanding</em> what we set out to understand in the first place.</p>

<h3 id="the-scenario-a-reasonably-deterministic-workload">The Scenario: A “Reasonably Deterministic” Workload</h3>

<p>Let’s start with our hypothetical/fictitious benchmark.
One rather strong assumption we are going to make is that our benchmark
is “reasonably deterministic”. Thus, when we run it multiple times,
it pretty much does the same thing.
To make this more concrete, let’s assume our benchmark does what one of the very first business applications did: <a href="https://en.wikipedia.org/wiki/LEO_(computer)">payroll</a>. We have a program that generates PDFs with the monthly payslips.
We run our benchmark on a Linux from 2026 and since our hypothetical benchmark
is written in Java, we use the HotSpot JVM and JDK 26.</p>

<h3 id="a-first-run">A First Run</h3>

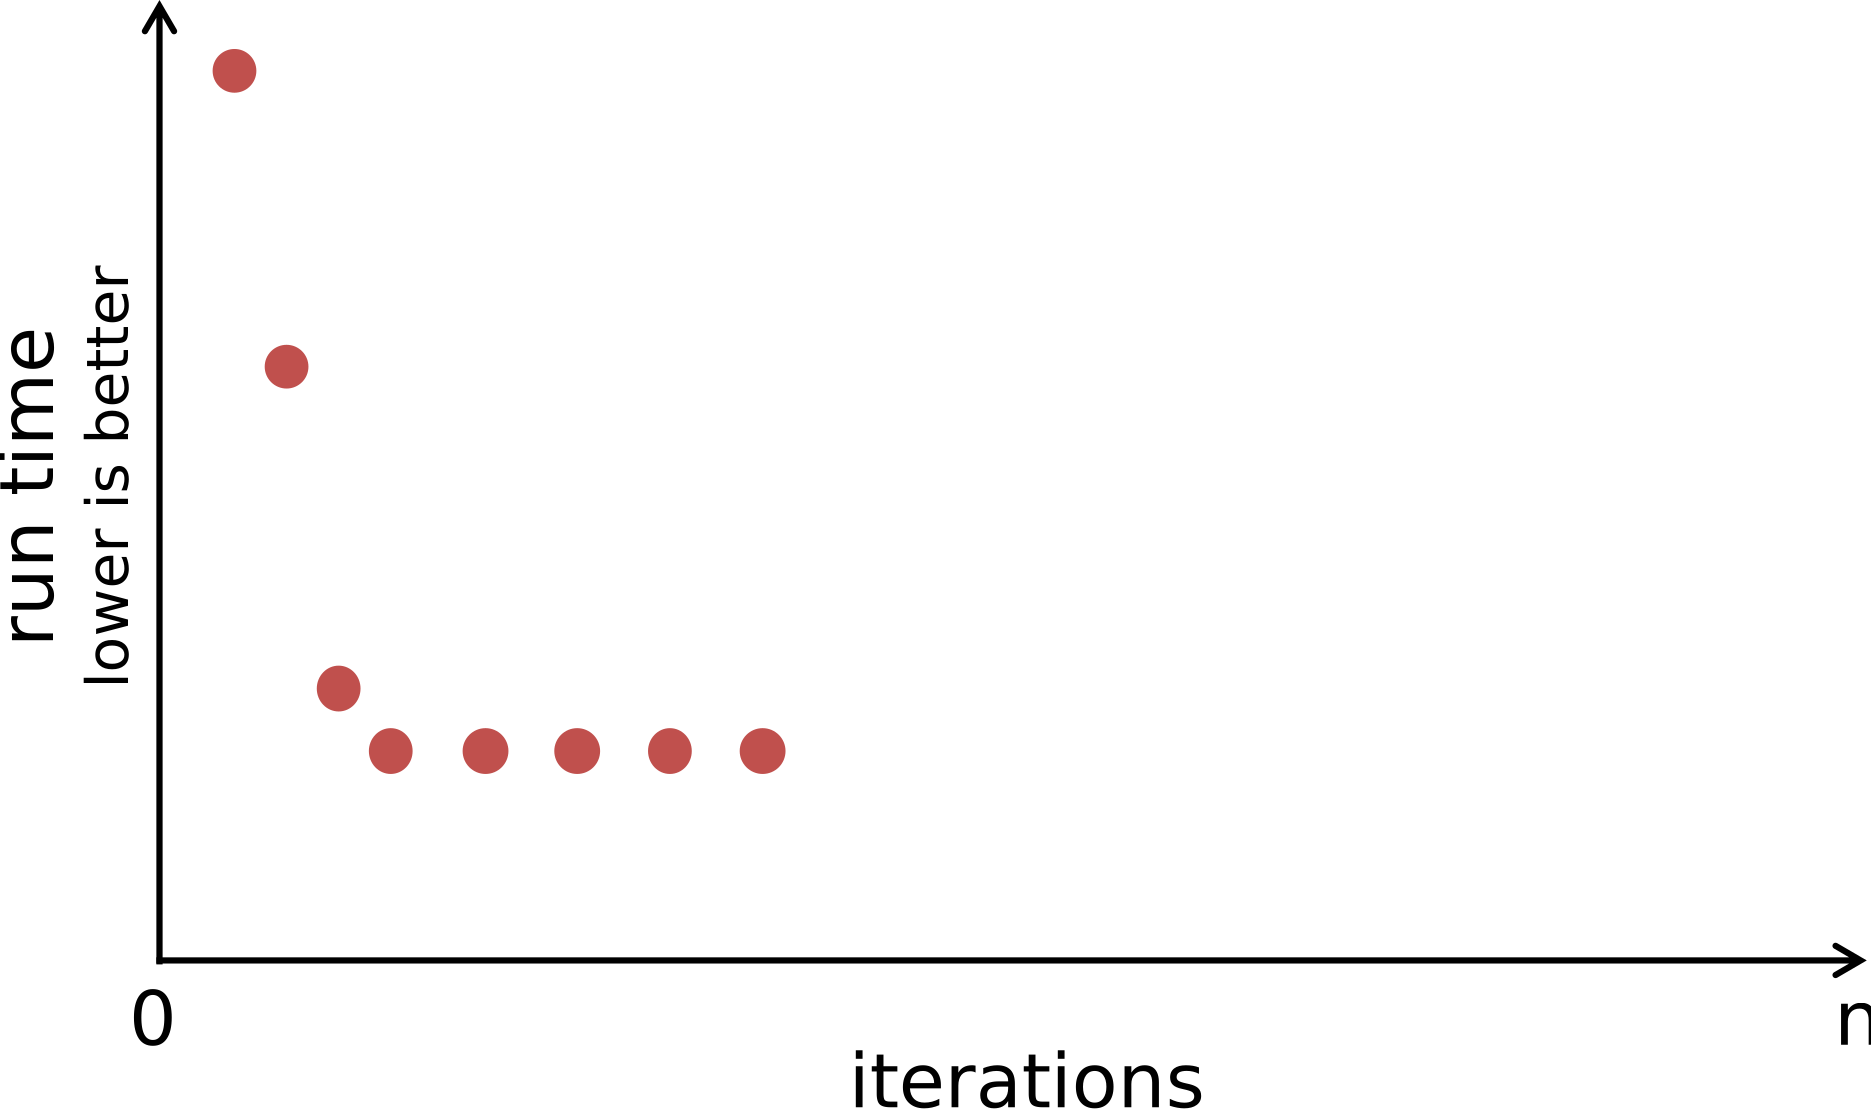
<p>We let this benchmark run for 8 iterations within the same JVM process
and visualize all our data points with a scatter plot. On the y-axis we show run time,
which means lower is better.
On the x-axis, we have the number of the specific iteration.</p>

<figure id="fig1">
<img src="/assets/2026/08/pitfalls/fig-01.svg" style="width: 70%" />
<figcaption><strong>Figure 1:</strong>
  A first run of our benchmark.
  The x-axis shows the iterations, and the y-axis the run time.
  Thus, lower is better. We see that each subsequent iteration
  got faster until iteration 4, and then we stayed at the same
  performance level.
</figcaption>
</figure>

<p>On the plot we can see that iterations 2, 3, 4 are each a bit faster than
the previous one, and then we stay at the same level of performance.</p>

<p>Given that we use a language implementation with just-in-time (JIT) compilation,
this is what we would roughly expect. The JIT compiler manages to optimize the
code we are executing step by step, and we see that it improves performance.</p>

<h3 id="a-second-run-same-benchmark-nothing-changed">A Second Run, Same Benchmark, Nothing Changed</h3>

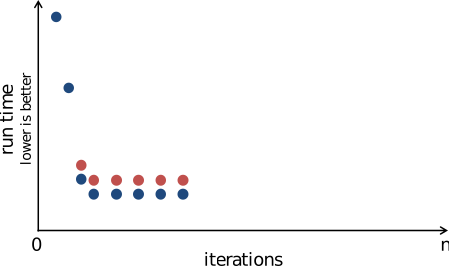
<p>We ran the exact same setup a second time,
getting 8 new data points.
But as we can see in <a href="#fig2">Figure 2</a>,
the benchmark is faster in iteration 3 and following!
What happened here?</p>

<figure id="fig2">
<img src="/assets/2026/08/pitfalls/fig-02.svg" style="width: 70%" />
<figcaption><strong>Figure 2:</strong>
  A second run of the same benchmark, with the same setup.
  Surprisingly, it is quite a bit faster than on the first run!
</figcaption>
</figure>

<p>This is where we now start hypothesizing.</p>

<p>What could it be?
It could be that the operating system decided
to give it different physical memory,
or run it on a different kind of core (many CPUs these days have 2 or more different types of cores with different performance).
Perhaps, we ran out of thermal budget and the CPU ran at a lower clock speed to
avoid overheating?
Or, since we are on a JVM,
perhaps the compiler saw slightly different information for the types/behavior
seen in the first and second iterations, and thus, made slightly different optimization decisions?
This is possible because compilation happens on a background thread, and thus,
even when the benchmark is deterministic, the used profiling information is to some degree <em>racy</em>.</p>

<p>It could also be something entirely different however, which means, we do not really know.</p>

<p>For designing your benchmark methodology,
you’ll need to decide on how to take these <em>variables</em> into account.
Sometimes, you may simply collect data from more runs, ideally many runs,
so that you can characterize this behavior as part of the
performance distribution one might likely observe in practice.
In other cases, this might be too naive, and you need to carefully control
for specific variables to get useful data from your experiments.
This can include pinning threads to specific cores, fixing CPU frequencies,
disabling address space layout randomization, etc. Each approach comes with different
tradeoffs.</p>

<h3 id="a-third-run-and-more-data">A Third Run, And More Data</h3>

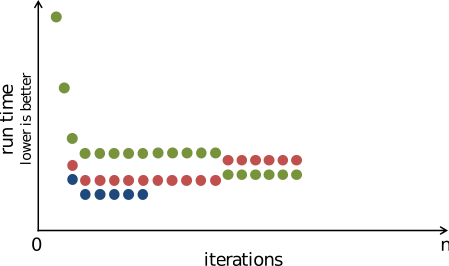
<p>We ran the same benchmark, with the very same setup, a third time.
And, we actually had a few more than the 8 data points I showed before.</p>

<figure id="fig3">
<img src="/assets/2026/08/pitfalls/fig-03.svg" style="width: 70%" />
<figcaption><strong>Figure 3:</strong>
  A third run of the same benchmark, with the same setup,
  and we had a few more iterations than shown before.
</figcaption>
</figure>

<p>The third run was slower. What happened now? Still guessing, we could assume
we simply didn’t get as lucky as the second time. Indeed, we might have gotten
rather unlucky, at least until iteration 14.
So, the same mechanisms that made the second run faster, could have now played
against us, and made the third run slower.
And that’s why performance is a <em>distribution</em>.</p>

<p>But, at iteration 15, something else happened in addition.
This isn’t a change between runs, i.e., a change between different operating system
processes. It’s a change within the same process, and after performance already looked <em>stable</em>.</p>

<p>Indeed, this might be something that happened hours, not minutes, after we thought
that performance is stable.
We could still be guessing that it is very much the same mechanisms as before though.
The operating system may just have decided our workload needs to be handled somehow differently: different core, different core type, different physical memory, etc.</p>

<p>Or it could have been a mechanism somewhere else in the software stack
that changed based on some heuristic that triggered only after that time.
And indeed, there are various mechanisms hiding.
<a href="https://d3s.mff.cuni.cz/files/publications/antoch_experimental_2026.pdf">Colleagues</a>
saw behavior like this in the JVM,
where it would free classes generated internally by the JVM
to speed up reflection.
The JVM sets a timeout based on the maximum heap size.
Using 1 second per MB of heap, which can mean it happens very late in an experiment.
Go, read their <a href="https://d3s.mff.cuni.cz/files/publications/antoch_experimental_2026.pdf">Experimental Evaluation Methodology for the Era of No Steady Performance</a> paper,
it’s a fun read.</p>

<h3 id="same-benchmark-different-input">Same Benchmark, Different Input</h3>

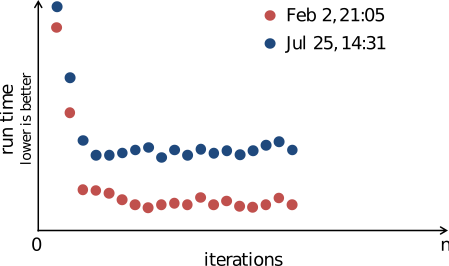
<p>Let’s look at one more set of fictitious results.</p>

<figure id="fig4">
<img src="/assets/2026/08/pitfalls/fig-04.svg" style="width: 70%" />
<figcaption><strong>Figure 4:</strong>
  Same benchmark, but different input. And, there has been some time between
  the two runs.
</figcaption>
</figure>

<p>This time, we see a more irregular pattern.
Though, we still see a major performance difference between the two runs.</p>

<p>Our hypotheses might include all of the above, but perhaps additionally,
it could include garbage collection (GC) more generally. We see a bit of an up and down.
So, perhaps the GCs are not fully part of every iteration,
as we might guess compared to the previous plots.
Thus, here we might see the impact of the JVM’s garbage collector.</p>

<p>But, it could also be something about the dates at which the experiments ran.</p>

<p>Did we run this on a laptop? Was it plugged into power in the past, and now isn’t, or the other way around? Was it cold in February, and now it’s hot, so, the CPU clocks itself down?
Did we update the software between these runs?</p>

<p>It really could be a million different things.</p>

<p>All we know is that it is probably not safe to assume that the data is comparable.
And that’s really the one thing we always need to investigate:
Are we confident that the data we obtained is comparable, or has some hidden variable changed that we did not account for?</p>

<h3 id="pitfalls-when-benchmarking">Pitfalls When Benchmarking</h3>

<p>When benchmarking, there are unfortunately a lot of things we may need to consider.
Some of them, we can find ways to account, i.e., control for.
Though, that’s at the risk of reviewers saying that the setup is unrealistic.
(I’d argue, explainability trumps realism in many cases.)
Other pitfalls, we might only be able to address by collecting more data.
And yet others might mean we need to start all over again.</p>

<p>Since this is a rather complex area, I do not have any quick and simple solutions.
So, let’s conclude with my incomplete overview of things to keep in mind:</p>

<ul>
  <li>Run-time optimizations
    <ul>
      <li>Feedback-based compiler decisions</li>
      <li>Memory changes, garbage collection</li>
    </ul>
  </li>
  <li>Security mechanisms
    <ul>
      <li>Address space layout randomization</li>
    </ul>
  </li>
  <li>Hardware complexity
    <ul>
      <li>Memory hierarchies, caches, locality</li>
      <li>Cores, core types, …</li>
      <li>Dynamic clock frequency changes
        <ul>
          <li>Thermal budgets</li>
        </ul>
      </li>
    </ul>
  </li>
  <li>Environmental impact
    <ul>
      <li>Temperature</li>
      <li>Power source</li>
    </ul>
  </li>
  <li>Software updates/changes
    <ul>
      <li>Linking order</li>
    </ul>
  </li>
</ul>

<p>And many more…</p>]]></content><author><name></name></author><category term="Research" /><category term="Benchmarking" /><category term="Science" /><category term="Methodology" /><category term="summer school" /><summary type="html"><![CDATA[Modern computer systems are quite fascinating. They are highly complex, run a lot of software, and their performance characteristics are hard or impossible to predict.]]></summary></entry><entry><title type="html">SSW@ECOOP’26: On Debugging, Benchmarking and (Meta-)Compilation</title><link href="https://stefan-marr.de/2026/06/ssw-at-ecoop-compilers-gc-debugging-meta-compilation/" rel="alternate" type="text/html" title="SSW@ECOOP’26: On Debugging, Benchmarking and (Meta-)Compilation" /><published>2026-06-16T09:47:00+02:00</published><updated>2026-06-16T09:47:00+02:00</updated><id>https://stefan-marr.de/2026/06/ssw-at-ecoop-compilers-gc-debugging-meta-compilation</id><content type="html" xml:base="https://stefan-marr.de/2026/06/ssw-at-ecoop-compilers-gc-debugging-meta-compilation/"><![CDATA[<p>At this year’s ECOOP, the Institute for System Software will be attending with the almost complete team
and we’re going to present on a variety of topics. Come and talk to us at ICOOOLPS, MPLR, the Demo Track, DEBT, ECOOP Academy, and at the poster session!</p>

<p>Below, a brief overview and when the talks are scheduled.</p>

<h3 id="monday-june-29-2pm-aot-meta-compilation-of-dynamic-languages">Monday, June 29, 2pm: AOT Meta-Compilation of Dynamic Languages</h3>

<h4 id="towards-ahead-of-time-meta-compilation-of-dynamic-languages-with-an-extensible-type-analysis"><a href="https://2026.ecoop.org/details/ICOOOLPS-2026-icooolps-2026/5/Towards-Ahead-of-Time-Meta-Compilation-of-Dynamic-Languages-With-an-Extensible-Type-A">Towards Ahead-of-Time Meta-Compilation of Dynamic Languages With an Extensible Type Analysis</a></h4>

<div style="padding-left:2em">
<p>
Christoph A. is going to present initial ideas of how to approach ahead-of-time meta-compilation
for dynamic languages. While some dynamic languages can already be compiled fairly successfully ahead of time, we would love to get the compiler for free, ideally from not much more than having to implement the interpreter.
</p>

<p><a href="https://stefan-marr.de/downloads/icooolps26-aigner-marr-towards-ahead-of-time-meta-compilation-of-dynamic-languages-with-an-extensible-type-analysis.pdf">Preprint of the ICOOOLPS position paper.</a></p>

<details><summary>Full Abstract</summary>
<p>Dynamically-typed languages rely on just-in-time (JIT) compilation for execution performance. Meta-compilation systems such as GraalVM's Truffle language implementation framework have reduced the effort needed of enabling JIT compilation to implementing an interpreter. But dynamic languages are increasingly used in scenarios where ahead-of-time (AOT) compilation would be preferable, for instance, for faster startup or to avoid the memory cost of JIT compilation. Therefore, we plan to extend meta-compilation systems to also support AOT compilation.</p>
<p>For successful AOT compilation of dynamically-typed languages, we need an extensive and robust type analysis. In this position paper, we present first ideas for a framework with an extensible core analysis that will enable us to extract type flow semantics from an interpreter implemented in a meta-compilation system.</p>
<p>To achieve the precision needed for fast machine code, we will need to include heuristic analyses. For this, we envision a plugin system that allows us to integrate various different heuristics into a singular unified analysis. Combining analyses in this way can produce results that are better than the sum of their parts.</p>
<p>While this is a very ambitious goal, given the complexity of compiling dynamic languages, we believe we can achieve better-than-interpreted performance for programs with <em>reasonable</em> behavior. Furthermore, to support the full language semantics we keep a general interpreter as a fallback.</p>
</details>
</div>

<h3 id="monday-june-29-3pm-pedagogical-annotations-in-a-debugger">Monday, June 29, 3pm: Pedagogical Annotations in a Debugger</h3>

<h4 id="towards-guided-omniscient-debugging-in-education-using-pedagogical-execution-traces"><a href="https://2026.ecoop.org/details/debt-2026-debt-2026/5/Towards-Guided-Omniscient-Debugging-in-Education-using-Pedagogical-Execution-Traces-">Towards Guided Omniscient Debugging in Education using Pedagogical Execution Traces</a></h4>

<div style="padding-left:2em">
<p>
Markus is going to present work on teaching programming by using debugging techniques.
Specifically, he will look at enriching program visualizations with explanations and interactive questions.</p>

<p><a href="https://ssw.jku.at/General/Staff/Weninger/Papers/Weninger_DEBT_26_Preprint.pdf">Preprint of the DEBT paper.</a></p>

<details><summary>Full Abstract</summary>
<p>Educators frequently use trace-based debuggers for live classroom demonstrations. Yet, if a student’s attention drops during class, they have to fall back to watching recordings (providing a passive, non-interactive experience) or replaying the debugging session at home (lacking the instructor’s pedagogical context and verbal explanations). We introduce Pedagogical Execution Traces (PETs), a concept that enriches execution traces with explanations, highlights and interactive questions. In this work-in-progress idea paper, we present the conceptual foundation of PETs as interactive learning artifacts, showing their applicability within JavaWiz, an educational trace-based graphical debugger. We explore PET authoring design goals and outline ongoing work regarding collaborative debugging scenarios and leveraging Large Language Models (LLMs) for trace annotation.</p>
</details>
</div>

<h3 id="tuesday-june-30-4pm-supporting-different-gcs-in-aot-compiled-binaries">Tuesday, June 30, 4pm: Supporting Different GCs in AOT-compiled Binaries</h3>

<h4 id="a-unifying-approach-to-supporting-multiple-garbage-collectors-in-aot-compiled-binaries"><a href="https://2026.ecoop.org/details/mplr-2026-papers/7/A-Unifying-Approach-to-Supporting-Multiple-Garbage-Collectors-in-AOT-compiled-Binarie">A Unifying Approach to Supporting Multiple Garbage Collectors in AOT-compiled Binaries</a></h4>

<div style="padding-left:2em">
<p>Thomas will present a fairly simple but effective approach to enable a single AOT-compiled binary for a Java program
to use different GCs. At the moment it supports HotSpot's G1 and a more basic generational GC.
</p>

<p><a href="https://stefan-marr.de/downloads/mplr26-schrott-et-al-a-unifying-approach-to-supporting-multiple-garbage-collectors-in-aot-compiled-binaries.pdf">Preprint of the MPLR paper.</a></p>


<details><summary>Full Abstract</summary>
<p>Some language implementations combine garbage collection with ahead-of-time compilation to produce self-contained executables for managed-language programs. In these systems, one can typically choose a garbage collector (GC) only at build time. To use another GC, e.g., for better performance,one needs to build another executable.</p>
<p>In this paper, we present an approach for supporting multiple GCs in the same self-contained executable using unified barriers, object layout, object header, and dynamic dispatch. This enables developers to select a GC at run time. Additionally, isolates, i.e., lightweight virtual machine instances with separate collected heaps but within the same process, can now use different GCs alongside each other.</p>
<p>We evaluate our approach in GraalVM Native Image, supporting the Garbage First (G1) and the Serial GC in the same executable. Our evaluation on the DaCapo Chopin and Renaissance benchmarks shows that G1 has on average no performance change (min. −9 %, max. 14 %). Serial GC shows a peak performance regression of 11 % (min. −10 %, max. 33 %). We believe the simplicity of the approach and that one can now choose the GC at run time and on a per isolate basis make this overhead acceptable.</p>
</details>
</div>

<h3 id="tuesday-june-30-5pm-reducing-binary-size-with-static-heuristics">Tuesday, June 30, 5pm: Reducing Binary Size with Static Heuristics</h3>

<h4 id="to-compile-or-not-to-compile-evaluating-static-heuristics-to-reduce-binary-size-of-hybrid-execution-systems"><a href="https://2026.ecoop.org/details/mplr-2026-papers/1/To-Compile-or-Not-To-Compile-Evaluating-Static-Heuristics-to-Reduce-Binary-Size-of-H">To Compile or Not To Compile: Evaluating Static Heuristics to Reduce Binary Size of Hybrid Execution Systems</a></h4>

<div style="padding-left:2em">
<p>Christoph P. will present his evaluation of how far one can get with basic static compiler heuristics,
when it comes to reducing the size of AOT-compiled Java binaries, while minimizing the impact on performance.</p>

<p><a href="https://stefan-marr.de/downloads/mplr26-pichler-et-al-to-compile-or-not-to-compile-evaluating-static-heuristics-to-reduce-binary-size-of-hybrid-execution-systems.pdf">Preprint of the MPLR paper.</a></p>


<details><summary>Full Abstract</summary>
<p>To compile, or not to compile, that is the question: When ’tis nobler to optimize for performance. Modern compilers have many different optimizations and optimization goals. A common one is to balance between peak performance and startup time. A new ahead-of-time compiled native executable that embeds a managed runtime tries to offer both, while solidifying the notion that everything should be compiled. However, the cost of an enlarged binary size raises the question whether it is beneficial to compile everything.</p>
<p>In this paper, we evaluate static heuristics from classical AOT compilers as well as other techniques based on our own observations. Our goal is to identify heuristics that work in a compilation-first environment and that allow us to reduce binary size while maintaining peak performance.</p>
<p>We compare the different policies in a closed-world hybrid execution system for Java, based on GraalVM Native Image, on a set of 5 DaCapo and 13 Renaissance benchmarks. We find that with the best combination of heuristics we can reduce binary size by 20% while slowing down average performance by only 4%, but avoiding the need for any run-time feedback or complex machine-learning-based approaches. The most promising combination for production use combines heuristics based on early returns, estimated CPU cycles, number of parameters, and whether a method is a static initializer.</p>
</details>
</div>

<h3 id="date-tbc-a-debugger-for-teaching-threads-and-locks">Date TBC: A Debugger for Teaching Threads and Locks</h3>

<h4 id="javawiz-threadviz---a-visual-debugger-for-multi-threaded-programs-based-on-the-espresso-java-vm"><a href="https://2026.ecoop.org/details/ecoop-2026-demo/4/JavaWiz-ThreadViz-A-Visual-Debugger-for-Multi-threaded-Programs-Based-on-the-Espres">JavaWiz ThreadViz - A Visual Debugger for Multi-threaded Programs Based on the Espresso Java VM</a></h4>

<div style="padding-left:2em">
<p>Melissa is going to present a visual debugger designed for teaching threads and locks in Java.
Threads, locks, and their interaction can feel hard to explain, though, with the right representation
in a debugging tool, their dynamic interactions can become more understandable.</p>

<p><a href="https://ssw.jku.at/General/Staff/Weninger/Papers/Sen_ECOOP_26_Preprint.pdf">Preprint of the Demo paper.</a></p>

<details><summary>Full Abstract</summary>
<p>Programming novices often face difficulties understanding how multi-threading works. Visual debuggers such as JavaWiz can support beginners by providing dynamic visualizations of a program’s behavior, however, they usually only work for single-threaded programs. This paper presents ThreadViz, an extension of JavaWiz to support visualizing multi-threaded Java programs.</p>
<p>In ThreadViz, thread information is collected for visualization by using the Truffle Debug API.
Instead of real concurrency, threads are executed stepwise, allowing the user to determine the order of execution and preventing any unpredictable behavior. In the user interface, a unique color is associated with each thread to illustrate the effects of different synchronization mechanisms such as locking and indicate thread state changes. To conclude, application examples are presented to highlight the tool's capabilities.</p>
</details>
</div>

<h3 id="friday-july-3-11am-a-lecture-on-benchmarking">Friday, July 3, 11am: A Lecture on Benchmarking</h3>

<h4 id="benchmarking-on-modern-hardware-techniques-for-performance-comparisons-from-day-to-day-experimenting-to-paper-writing"><a href="https://2026.ecoop.org/details/ecoop-2026-academy/1/Benchmarking-on-Modern-Hardware-Techniques-for-Performance-Comparisons-from-Day-To-D">Benchmarking on Modern Hardware: Techniques for Performance Comparisons from Day-To-Day Experimenting to Paper Writing</a></h4>

<div style="padding-left:2em">
<p>Last but not least, I'll give a lecture on benchmarking. Modern hard- and software makes that quite a bit more complicated than what we would like it to be and I will show a bit how we approach it in practice.</p>

<details><summary>Full Abstract</summary>
<p>Modern systems are great! In many ways, they adapt to our software, and optimize it, despite us not really knowing what we are doing, and to a degree that would have been considered magic just a few decades ago.</p>
<p>Though, once we develop our own research ideas on top of these systems and want to make any argument about performance, all this “magic” makes it hard to understand what measurements mean. Worse yet, making sensible performance claims means we have to understand a good chunk of it. Is this benchmark 20% faster because of what I did, or did the CPU increase the clock frequency for the new but not for the old code? Did the JVM just trigger garbage collection? Did the just-in-time compiler slow down my code? What do you mean, “efficiency core”?</p>
<p>In this lecture, we will have a brief look at why benchmarking on modern systems is hard and what can go wrong. Then we will discuss a range of different research scenarios to get a better feeling of what we may need for our work. Since much of this work may involve gradually building up our own systems, we will also look at what it takes to build them based on reliable feedback.</p>
<p>In the second part, we will look at how we can turn the often chaotic scientific process, with all its trials and errors, into a “scientific engineering process” that enables us to try and try again. I’ll suggest a process that allows us to use the same setup that we use for developing our system to not just understand its performance, but also use it to run the experiments we may want for a scientific paper. I’ll demonstrate how to go from daily pull requests with continuous performance tracking to generating plots and statistics for direct inclusion in LaTeX.</p>
</details>
</div>]]></content><author><name></name></author><category term="Research" /><category term="Metacompilation" /><category term="compilation" /><category term="garbage collection" /><category term="Debugging" /><category term="Benchmarking" /><summary type="html"><![CDATA[At this year’s ECOOP, the Institute for System Software will be attending with the almost complete team and we’re going to present on a variety of topics. Come and talk to us at ICOOOLPS, MPLR, the Demo Track, DEBT, ECOOP Academy, and at the poster session!]]></summary></entry><entry><title type="html">Programming Language Implementation: In Theory, We Understand. In Practice, We Wish We Would.</title><link href="https://stefan-marr.de/2026/02/programming-language-implementation-in-theory-we-understand-in-practice-we-wish-we-would/" rel="alternate" type="text/html" title="Programming Language Implementation: In Theory, We Understand. In Practice, We Wish We Would." /><published>2026-02-02T15:15:10+01:00</published><updated>2026-02-02T15:15:10+01:00</updated><id>https://stefan-marr.de/2026/02/programming-language-implementation-in-theory-we-understand-in-practice-we-wish-we-would</id><content type="html" xml:base="https://stefan-marr.de/2026/02/programming-language-implementation-in-theory-we-understand-in-practice-we-wish-we-would/"><![CDATA[<p>It’s February! This means I have been <a href="https://stefan-marr.de/2025/10/first-day-at-jku/">at the JKU</a> for four months.
Four months with teaching <a href="https://ssw.jku.at/Teaching/Lectures/CB/VL/">Compiler Construction</a> and <a href="https://ssw.jku.at/Teaching/Lectures/SSW/">System Software</a>,
lots of new responsibilities (most notably signing off on telephone bills and coffee orders…), many new colleagues, and new things to learn for me, not least because of the very motivated students and PhD students here.
And when I say motivated, yes, I am very surprised. While the attendance of my 8:30am Compiler Construction lectures was declining throughout the term as expected, the students absolutely aced their exam.
I suspect I will have to make it harder next year. Much harder… hmmm 🤔
Much of the good results can likely be attributed to the very extensive exercise sessions run by my colleagues throughout the semester.</p>

<p>At this point, I have to send a big <em>thank you</em> to everyone from the <a href="https://ssw.jku.at/General/Staff/">Institute for System Software</a>, past and present.
It’s great to be part of such a team! You made my start very easy, and, well, it now gives me the time to think about my inaugural lecture.</p>

<h2 id="whats-an-inaugural-lecture">What’s an inaugural lecture?</h2>

<p>I have been in academia for almost two decades, but I have to admit, I don’t really remember being at an inaugural lecture.
According to Wikipedia, in the Germanic tradition an <a href="https://de.wikipedia.org/wiki/Antrittsvorlesung">inaugural lecture (Antrittsvorlesung)</a> is these days something of a celebration.
It’s a festive occasion for a new professor to present their field to a wider audience, possibly also presenting their research vision.</p>

<p>At the JKU, it indeed seems to be planned as a festive occasion, too.</p>

<p>On March 9th, 2026, starting at 4pm Prof. Bernhard Aichernig and I will give our <em>Antrittsvorlesungen</em>,
and you are <a href="https://www.jku.at/fileadmin/gruppen/90/Downloads/AVO_Aichernig_Marr/2026-03-09_Einladung_AVOL_Aichernig_Marr.pdf">cordially invited to attend</a>.</p>

<p>Bernhard will give a talk titled <a href="https://www.jku.at/fileadmin/gruppen/90/Downloads/AVO_Aichernig_Marr/Infoblatt_AVO_Aichernig_en.pdf">Verification, Falsification, and Learning – a Triptych of Formal Methods for Trustworthy IT Systems</a>.</p>

<p>My own talk is titled, as is this post: <a href="https://www.jku.at/fileadmin/gruppen/90/Downloads/AVO_Aichernig_Marr/Infoblatt_AVO_Marr_en.pdf">Programming Language Implementation: In Theory, We Understand. In Practice, We Wish We Would</a>.</p>

<p>Bernhard will start out by looking at the formal side of things, making the connection between proving correctness, testing systems in the context of where they are used, and learning models from observable data. My talk will narrow in on language implementations, but also look at how formal correctness is helping us there.
Unfortunately, provably-correct systems still elude us for many practical languages.
Even worse, we are at a point where we rarely understand what’s going on in enough detail to improve performance or perhaps fix certain rare bugs.</p>

<p>If you like to attend, <a href="http://www.jku.at/vas">please register here</a>.</p>

<h2 id="in-theory-we-understand-in-practice-we-wish-we-would">In Theory, We Understand. In Practice, We Wish We Would</h2>

<p>Here’s the abstract of my talk:</p>

<blockquote>
  <p>Our world runs on software, but we understand it less and less. In practice, the complexity of modern
systems drains your phone’s battery faster, increases the cost of hosting applications, and consumes
unnecessary resources, for instance, in AI systems. All because we do not truly understand our
systems any longer. Still, at a basic level, we can fully understand how computers work, from
transistors to processors, machine language, all the way up to high-level programming languages.</p>

  <p>The convenience of contemporary programming languages is however bought with complexity. Over
the last two decades, I admit, I added to that complexity. In the next two decades, I hope we can learn
to build programming languages in ways that we can prove to be correct, enable us to generate their
implementations automatically, and let systems select optimizations in a way that we can still
understand the implications for software running on top of it.</p>
</blockquote>

<p>You may now wonder where to go from here. And that’s a very good question.
I have another month to figure that out, perhaps more… 😅</p>

<p>So, maybe see you in March?</p>

<p>Until then, suggestions, questions, and complaints, as usual on 
<a href="https://mastodon.acm.org/@smarr/115297555824308876">Mastodon</a>,
<a href="https://bsky.app/profile/stefan-marr.de/post/3m24gusnpnk2l">BlueSky</a>, and
<a href="https://x.com/smarr/status/1973277801689260347">Twitter</a>.</p>]]></content><author><name></name></author><category term="Personal" /><category term="Personal" /><category term="Research" /><category term="Teaching" /><category term="Linz" /><summary type="html"><![CDATA[It’s February! This means I have been at the JKU for four months. Four months with teaching Compiler Construction and System Software, lots of new responsibilities (most notably signing off on telephone bills and coffee orders…), many new colleagues, and new things to learn for me, not least because of the very motivated students and PhD students here. And when I say motivated, yes, I am very surprised. While the attendance of my 8:30am Compiler Construction lectures was declining throughout the term as expected, the students absolutely aced their exam. I suspect I will have to make it harder next year. Much harder… hmmm 🤔 Much of the good results can likely be attributed to the very extensive exercise sessions run by my colleagues throughout the semester.]]></summary></entry><entry><title type="html">Python, Is It Being Killed by Incremental Improvements?</title><link href="https://stefan-marr.de/2026/01/python-killed-by-incremental-improvements-questionmark/" rel="alternate" type="text/html" title="Python, Is It Being Killed by Incremental Improvements?" /><published>2026-01-20T14:02:15+01:00</published><updated>2026-01-20T14:02:15+01:00</updated><id>https://stefan-marr.de/2026/01/python-killed-by-incremental-improvements-questionmark</id><content type="html" xml:base="https://stefan-marr.de/2026/01/python-killed-by-incremental-improvements-questionmark/"><![CDATA[<p>Over the past years, two major players invested into the future of Python. Microsoft’s Faster CPython team has pushed ahead with impressive performance improvements for the CPython interpreter, which has gotten at least 2x faster since Python 3.9. They also have a baseline JIT compiler for CPython, too. At the same time, Meta is worked hard on making free-threaded Python a reality to bring classic shared-memory multithreading to Python, without being limited by the still standard Global Interpreter Lock, which prevents true parallelism.</p>

<p>Both projects deliver major improvements to Python, and the wider ecosystem. So, it’s all great, or is it?</p>

<p>In <a href="https://youtu.be/03DswsNUBdQ">my talk talk on this topic at SPLASH, which is now online</a>, I discussed some of the aspects the Python core developers and wider community seem to not regard with the same urgency as I would hope for. Concurrency makes me scared, and I strongly believe the Python ecosystem should be scared, too, or look forward to the 2030s being “Python’s Decade of Concurrency Bugs”.</p>

<p>In the talk, I started out reviewing some of the changes in observable language semantics between Python 3.9 and today and discuss their implications.
I previously discussed the changes around the <em>global interpreter lock</em> in my post on the <a href="https://stefan-marr.de/2023/11/python-global-interpreter-lock/">changing “guarantees”</a>. In the talk, I also use the example from a real bug report, to illustrate the semantic changes:</p>

<div class="language-plaintext highlighter-rouge"><div class="highlight"><pre class="highlight"><code>request_id = self._next_id
self._next_id += 1
</code></pre></div></div>

<p>It looks simple, but reveals quite profound differences between Python versions.</p>

<p>Since I have some old ideas lying around, I also propose a way forward.
In practice though, this isn’t a small well-defined engineering or research project.
So, I hope I can inspire some of you to follow me down the rabbit hole of Python’s free-threaded future.</p>

<p>Incidentally, the <a href="https://truffleruby.dev/blog/truffleruby-33-is-released">latest release of TruffleRuby</a> now uses many of the techniques that would be useful for Python. <a href="https://eregon.me/">Benoit Daloze</a> implemented them during his PhD and we originally <a href="https://stefan-marr.de/downloads/oopsla18-daloze-et-al-parallelization-of-dynamic-languages-synchronizing-built-in-collections.pdf">published the ideas back in 2018</a>.</p>

<p>Questions, pointers, and suggestions are always welcome, for instance, on
<a href="https://mastodon.acm.org/@smarr/115927813942871408">Mastodon</a>,
<a href="https://bsky.app/profile/stefan-marr.de/post/3mcudj6o42k24">BlueSky</a>, or
<a href="https://x.com/smarr/status/2013615257567023329">Twitter</a>.</p>

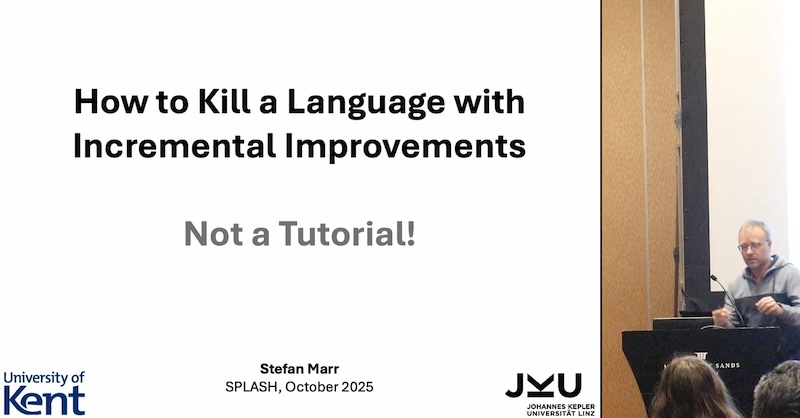
<p><a href="https://youtu.be/03DswsNUBdQ"><img src="/assets/2026/01/python-killed-by-incremental-improvements.jpg" alt="Screen grab of recording, showing title slide and myself at the podium." style="width: 100%; border: 1px solid black;" /></a></p>

<h3 id="slides">Slides</h3>

<iframe src="https://1drv.ms/p/c/30da3b1ead53408b/IQSrY83HcUNEToYQr3sV76i1AQwQ0IKantC0U-qsl0LHhwE" width="592" height="481" frameborder="0" scrolling="no"></iframe>]]></content><author><name></name></author><category term="Research" /><category term="Python" /><category term="Research" /><category term="Concurrency" /><category term="Concurrency Models" /><category term="CPython" /><category term="Interpreters" /><category term="Language Implementation" /><category term="Dynamic Languages" /><category term="Language Design" /><category term="Parallelism" /><category term="Presentation" /><summary type="html"><![CDATA[Over the past years, two major players invested into the future of Python. Microsoft’s Faster CPython team has pushed ahead with impressive performance improvements for the CPython interpreter, which has gotten at least 2x faster since Python 3.9. They also have a baseline JIT compiler for CPython, too. At the same time, Meta is worked hard on making free-threaded Python a reality to bring classic shared-memory multithreading to Python, without being limited by the still standard Global Interpreter Lock, which prevents true parallelism.]]></summary></entry><entry><title type="html">Benchmarking Language Implementations: Am I doing it right? Get Early Feedback!</title><link href="https://stefan-marr.de/2025/11/experimental-setups/" rel="alternate" type="text/html" title="Benchmarking Language Implementations: Am I doing it right? Get Early Feedback!" /><published>2025-11-17T19:00:24+01:00</published><updated>2025-11-17T19:00:24+01:00</updated><id>https://stefan-marr.de/2025/11/experimental-setups</id><content type="html" xml:base="https://stefan-marr.de/2025/11/experimental-setups/"><![CDATA[<p>Modern CPUs, operating systems, and software in general do lots of smart and hard-to-track optimizations, leading to warmup behavior, cache effects, profile pollution and other unexpected interactions.
For us engineers and scientists, whether in industry or academia, this unfortunately means that we may not fully understand the system on top of which we are trying to measure the performance impact of, for instance, an optimization, a new feature, a data structure, or even a bug fix.</p>

<p>Many of us even treat the hardware and software we run on top of as black boxes, relying on the <em>scientific method</em> to give us a good degree of confidence in the understanding of the performance results we are seeing.</p>

<p>Unfortunately, with the complexity of today’s systems, we can easily miss important confounding variables.
Did we account, e.g., for CPU frequency scaling, garbage collection, JIT compilation, and network latency correctly?
If not, this can lead us down the wrong, and possibly time-consuming path of implementing experiments that do not yield the results we are hoping for, or our experiments are too specific to allow us to draw general conclusions.</p>

<p>So, what’s the solution? What could a PhD student or industrial researcher do when planning for the next large project?</p>

<p>How about getting early feedback?</p>

<h3 id="get-early-feedback-at-a-language-implementation-workshop">Get Early Feedback at a Language Implementation Workshop!</h3>

<p>At the <a href="https://2025.programming-conference.org/home/MoreVMs-2025#exp-setup">MoreVMs</a> and <a href="https://conf.researchr.org/home/icfp-splash-2025/vmil-2025#Call-for-Papers">VMIL</a> workshop series, we introduced a new category of submissions last year:
<em>Experimental Setups</em>.</p>

<p>We solicited extended abstracts that focus on the experiments themselves before an implementation is completed.
This way, the experimental setup can receive feedback and guidance to improve the chances that the experiments lead to the desired outcomes. With early feedback, we can avoid common traps and pitfalls, share best practices, and deeper understanding of the systems we are using.</p>

<p>With the complexity of today’s systems, one person, or even one group, is not likely to think of all the issues that may be relevant. Instead of encountering these issues only in the review process after all experiments are done, we can share knowledge and ideas ahead of time, and hopefully <em>improve the science</em>!</p>

<p>So, if you think you may benefit from such feedback, please consider submitting an extended abstract describing your experimental goals and methodology. No results needed!</p>

<p>The next submission deadlines for the <a href="https://2026.programming-conference.org/home/MoreVMs-2026">MoreVMs’26 workshop</a> are:</p>
<ul>
  <li>December 17th, 2025</li>
  <li>January 12th, 2026</li>
</ul>

<p>For questions and suggestions, find me on
<a href="https://mastodon.acm.org/@smarr/115571485445944651">Mastodon</a>,
<a href="https://bsky.app/profile/stefan-marr.de/post/3m5w3ouay222f">BlueSky</a>, or
<a href="https://x.com/smarr/status/1990808954067177885">Twitter</a>, or send me an <a href="https://ssw.jku.at/General/Staff/Marr/">email</a>!</p>]]></content><author><name></name></author><category term="Research" /><category term="Benchmarking" /><category term="Workshops" /><category term="Publications" /><category term="Papers" /><category term="Science" /><category term="Methodology" /><summary type="html"><![CDATA[Modern CPUs, operating systems, and software in general do lots of smart and hard-to-track optimizations, leading to warmup behavior, cache effects, profile pollution and other unexpected interactions. For us engineers and scientists, whether in industry or academia, this unfortunately means that we may not fully understand the system on top of which we are trying to measure the performance impact of, for instance, an optimization, a new feature, a data structure, or even a bug fix.]]></summary></entry><entry><title type="html">Can We Know Whether a Profiler is Accurate?</title><link href="https://stefan-marr.de/2025/10/can-we-know-whether-a-profiler-is-accurate/" rel="alternate" type="text/html" title="Can We Know Whether a Profiler is Accurate?" /><published>2025-10-15T02:26:28+02:00</published><updated>2025-10-15T02:26:28+02:00</updated><id>https://stefan-marr.de/2025/10/can-we-know-whether-a-profiler-is-accurate</id><content type="html" xml:base="https://stefan-marr.de/2025/10/can-we-know-whether-a-profiler-is-accurate/"><![CDATA[<p>If you have been following the adventures of our <a href="https://github.com/HumphreyHCB">hero</a> over the last couple of years,
you might remember that we <a href="https://stefan-marr.de/2023/09/dont-blindly-trust-your-profiler/">can’t really trust sampling profilers for Java</a>,
and <a href="https://stefan-marr.de/2024/09/instrumenation-based-profiling-on-jvms-is-broken/">it’s even worse for Java’s instrumentation-based profilers</a>.</p>

<p>For sampling profilers, the so-called <em>observer effect</em> gets in the way: when we profile a program, the profiling itself can change the program’s performance behavior. This means we can’t simply increase the sampling frequency to get a more accurate profile, because the sampling causes inaccuracies.
So, how could we possibly know whether a profile correctly reflects an execution?</p>

<p>We could try to look at the code and estimate how long each bit takes, and then painstakingly compute what an accurate profile would be. Unfortunately, with the complexity of today’s processors and language runtimes, this would require a cycle-accurate simulator that needs to model everything, from the processor’s pipeline, over the cache hierarchy, to memory and storage.
While there are simulators that do this kind of thing, they are generally too slow to simulate a full JVM with JIT compilation for any interesting program within a practical amount of time.
This means that simulation is currently impractical, and it is impractical to determine what a <em>ground truth</em> would be.</p>

<p>So, what other approaches might there be to determine whether a profile is accurate?</p>

<p>In 2010, <a href="https://dl.acm.org/doi/10.1145/1806596.1806618">Mytkowicz et al.</a> already checked whether Java profilers were <em>actionable</em>
by inserting computations at the Java bytecode level.
On today’s VMs, that’s unfortunately an approach that changes performance in fairly unpredictable ways, because it interacts with the compiler optimizations.
However, the idea to check whether a profiler accurately reflects the slowdown of a program is sound.
For example, an inaccurate profiler is less likely to correctly identify a change in the distribution of where a program spends its time.
Similarly, if we change the overall amount of time a program takes, without changing the distribution of where time is spent,
it may attribute run time to the wrong parts of a program.</p>

<p>We can detect both of these issues by accurately slowing down a program.
And, as you might know from the <a href="/2025/08/how-to-slow-down-a-program/">previous post</a>,
we are able to slow down programs fairly accurately.
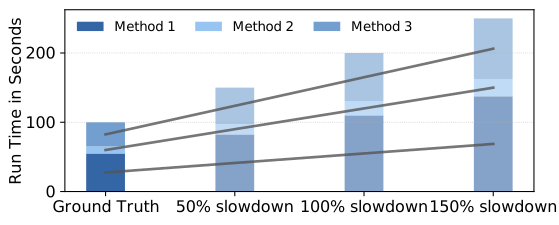
<a href="#fig1">Figure 1</a> illustrates the idea with a stacked bar chart for a hypothetical distribution of run-time over three methods. This distribution should remain identical, independent of a slowdown observed by the program.
So, there’s a linear relation between the absolute time measured and a constant relation between the percentage of time per method, depending on the slowdown.</p>

<figure id="fig1">
<img src="/assets/2025/10/sketch-of-ideal-slowdown.svg" />
<figcaption><strong>Figure 1:</strong> A stacked bar chart for a hypothetical program execution, showing the absolute time per method. A profiler should see the linear increase in run time taken by each method, but still report the same percentage of run time taken. If a profiler reports something else, we have found an inaccuracy.</figcaption>
</figure>

<p>With this slowdown approach, we can detect whether the profiler is accurate with respect to the predicted time increase.
I’ll leave all the technical details to the <a href="#paper">paper</a>.
We can also slow down individual basic blocks accurately to make a particular method take more time.
As it turns out, this is a good litmus test for the accuracy of profilers,
and we find a number of examples where they fail to attribute the run time correctly.
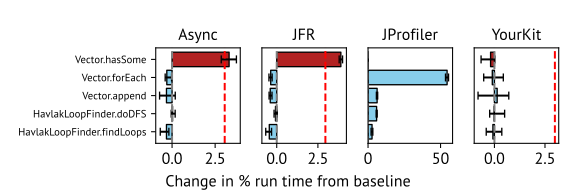
<a href="#fig2">Figure 2</a> shows an example for the <a href="https://github.com/smarr/are-we-fast-yet/tree/master/benchmarks/Java/src/havlak">Havlak benchmark</a>.
The bar charts show how much change the four profilers detect after we slowed down
<code>Vector.hasSome</code> to the level indicated by the red dashed line.
In this particular example, async-profiler detects the change accurately.
JFR is probably within the margin of error.
However, JProfiler and YourKit are completely off. JProfiler likely can’t deal with inlining and attributes the change to the <code>forEach</code> method that calls <code>hasSome</code>.
YourKit does not seem to see the change at all.</p>

<figure id="fig2">
<img src="/assets/2025/10/havlak-slowdown-of-hassome.svg" />
<figcaption><strong>Figure 2:</strong> Bar chart with the change in run time between the baseline and slowed-down version, for the top 5 methods of the Havlak benchmark. 
The red dashed line indicates the expected change for the <code>Vector.hasSome</code> method. Only async-profiler and JFR come close to the expectation.</figcaption>
</figure>

<p>With this slowdown-based approach, we finally have a way to see how accurate sampling profilers are by approximating the <em>ground truth</em> profile. Since we can’t measure the ground truth directly, we found a way to sidestep a fundamental problem and found a reasonably practical solution.</p>

<p>The <a href="#paper">paper</a> details how we implement our <em>divining</em> approach, i.e., how we slow down programs accurately.
It also has all the methodological details, research questions, benchmarking setup, and lots more numbers, especially in the appendix. So, please give it a read, and let us know what you think.</p>

<p>If you happen to attend the SPLASH conference,
Humphrey is presenting our work <a href="https://conf.researchr.org/details/icfp-splash-2025/vmil-2025/3/Evaluating-Candidate-Instructions-for-Reliable-Program-Slowdown-at-the-Compiler-Level">today</a> and on <a href="https://2025.splashcon.org/details/OOPSLA/207/Divining-Profiler-Accuracy-An-Approach-to-Approximate-Profiler-Accuracy-Through-Mach">Saturday</a>.</p>

<p>Questions, pointers, and suggestions are always welcome, for instance, on
<a href="https://mastodon.acm.org/@smarr/115375396310482176">Mastodon</a>,
<a href="https://bsky.app/profile/stefan-marr.de/post/3m36z2u34tk2l">BlueSky</a>, or
<a href="https://x.com/smarr/status/1978259584432091530">Twitter</a>.</p>

<p>Thanks to <a href="https://octavelarose.github.io/">Octave</a> for feedback on this post.</p>

<p>Update: The <a href="https://youtu.be/U-7PEopwtKA">recording of the talk</a> is now on YouTube.</p>

<iframe width="560" height="315" src="https://www.youtube.com/embed/U-7PEopwtKA?si=Qd3OgW3B2IDmJ4cX" title="YouTube video player" frameborder="0" allow="accelerometer; autoplay; clipboard-write; encrypted-media; gyroscope; picture-in-picture; web-share" referrerpolicy="strict-origin-when-cross-origin" allowfullscreen=""></iframe>

<p><a id="paper"></a></p>

<p><strong>Abstract</strong></p>

<blockquote>
  <p>Optimizing performance on top of modern runtime systems with just-in-time (JIT) compilation is a challenge for a wide range of applications from browser-based applications on mobile devices to large-scale server applications. Developers often rely on sampling-based profilers to understand where their code spends its time. Unfortunately, sampling of JIT-compiled programs can give inaccurate and sometimes unreliable results.</p>

<p>To assess accuracy of such profilers, we would ideally want to compare their results to a known ground truth. With the complexity of today’s software and hardware stacks, such ground truth is unfortunately not available. Instead, we propose a novel technique to approximate a ground truth by accurately slowing down a Java program at the machine-code level, preserving its optimization and compilation decisions as well as its execution behavior on modern CPUs.</p>

<p>Our experiments demonstrate that we can slow down benchmarks by a specific amount, which is a challenge because of the optimizations in modern CPUs, and we verified with hardware profiling that on a basic-block level, the slowdown is accurate for blocks that dominate the execution. With the benchmarks slowed down to specific speeds, we confirmed that async-profiler, JFR, JProfiler, and YourKit maintain original performance behavior and assign the same percentage of run time to methods. Additionally, we identify cases of inaccuracy caused by missing debug information, which prevents the correct identification of the relevant source code. Finally, we tested the accuracy of sampling profilers by approximating the ground truth by the slowing down of specific basic blocks and found large differences in accuracy between the profilers.</p>

<p>We believe, our slowdown-based approach is the first practical methodology to assess the accuracy of sampling profilers for JIT-compiling systems and will enable further work to improve the accuracy of profilers.</p>

</blockquote>

<ul>
  <li>Divining Profiler Accuracy: An Approach to Approximate Profiler Accuracy Through Machine Code-Level Slowdown<br />
    
      
      H. Burchell,
      <em>
      S. Marr</em>;

    
        Proceedings of the ACM on Programming Languages,
      

    OOPSLA'25,
    

    ACM,
    2025.

    </li>

    <li>
      Paper:
        <a href="https://stefan-marr.de/downloads/oopsla25-burchell-marr-divining-profiler-accuracy.pdf">
          PDF</a>
    </li>

    <li>
        DOI: <a href="https://doi.org/10.1145/3763180">10.1145/3763180</a>
    </li>

    
    <li>
      Appendix: <a href="https://doi.org/10.5281/zenodo.16911348">online appendix</a>
    </li>


    <li>
      BibTex:
      <span tabindex="0" class="bibtex"><span class="biblink">bibtex</span>
      <pre>@article{Burchell:2025:Divining,
  abstract = {Optimizing performance on top of modern runtime systems with just-in-time (JIT) compilation is a challenge for a wide range of applications from browser-based applications on mobile devices to large-scale server applications. Developers often rely on sampling-based profilers to understand where their code spends its time. Unfortunately, sampling of JIT-compiled programs can give inaccurate and sometimes unreliable results.
  
  To assess accuracy of such profilers, we would ideally want to compare their results to a known ground truth. With the complexity of today's software and hardware stacks, such ground truth is unfortunately not available. Instead, we propose a novel technique to approximate a ground truth by accurately slowing down a Java program at the machine-code level, preserving its optimization and compilation decisions as well as its execution behavior on modern CPUs.
  
  Our experiments demonstrate that we can slow down benchmarks by a specific amount, which is a challenge because of the optimizations in modern CPUs, and we verified with hardware profiling that on a basic-block level, the slowdown is accurate for blocks that dominate the execution. With the benchmarks slowed down to specific speeds, we confirmed that async-profiler, JFR, JProfiler, and YourKit maintain original performance behavior and assign the same percentage of run time to methods. Additionally, we identify cases of inaccuracy caused by missing debug information, which prevents the correct identification of the relevant source code. Finally, we tested the accuracy of sampling profilers by approximating the ground truth by the slowing down of specific basic blocks and found large differences in accuracy between the profilers.
  
  We believe, our slowdown-based approach is the first practical methodology to assess the accuracy of sampling profilers for JIT-compiling systems and will enable further work to improve the accuracy of profilers.},
  acceptancerate = {0.356},
  appendix = {https://doi.org/10.5281/zenodo.16911348},
  articleno = {402},
  author = {Burchell, Humphrey and Marr, Stefan},
  blog = {https://stefan-marr.de/2025/10/can-we-know-whether-a-profiler-is-accurate/},
  doi = {10.1145/3763180},
  issn = {2475-1421},
  journal = {Proceedings of the ACM on Programming Languages},
  keywords = {Accuracy GroundTruth Java MeMyPublication Profiling Sampling myown},
  month = oct,
  number = {OOPSLAB25},
  numpages = {32},
  pdf = {https://stefan-marr.de/downloads/oopsla25-burchell-marr-divining-profiler-accuracy.pdf},
  publisher = {{ACM}},
  series = {OOPSLA'25},
  title = {{Divining Profiler Accuracy: An Approach to Approximate Profiler Accuracy Through Machine Code-Level Slowdown}},
  year = {2025},
  month_numeric = {10}
}
</pre>
      </span>
    </li>
</ul>]]></content><author><name></name></author><category term="Research" /><category term="Java" /><category term="Benchmarking" /><category term="Research" /><category term="Profilers" /><category term="Sampling" /><category term="Instrumentation" /><category term="Tooling" /><category term="paper" /><summary type="html"><![CDATA[If you have been following the adventures of our hero over the last couple of years, you might remember that we can’t really trust sampling profilers for Java, and it’s even worse for Java’s instrumentation-based profilers.]]></summary></entry><entry><title type="html">First Day: A New Chapter at the JKU</title><link href="https://stefan-marr.de/2025/10/first-day-at-jku/" rel="alternate" type="text/html" title="First Day: A New Chapter at the JKU" /><published>2025-10-01T08:02:19+02:00</published><updated>2025-10-01T08:02:19+02:00</updated><id>https://stefan-marr.de/2025/10/first-day-at-jku</id><content type="html" xml:base="https://stefan-marr.de/2025/10/first-day-at-jku/"><![CDATA[<p>It’s Wednesday. Is this important? It’s my first day in a new position. So, perhaps the real question is: what’s going to be important to me from now on?</p>

<p>Let’s get the titles out of the way first:
Today is my first day as <em>Universitäts­professor</em>. That’s a <em>full professor</em>, <em>chair</em>, <em>W3 Professor</em>, <em>gewoon hoogleraar</em>, or similar. Yeah, there are lots of <a href="https://en.wikipedia.org/wiki/List_of_academic_ranks">different names in different countries</a>. It’s also my first day as the head of the <a href="https://ssw.jku.at/">Institute for System Software</a>.
The term <em>institute</em> is used here for something that’s a research group in many other places.
This means I have the opportunity to work with a number of very smart people to offer university courses in the field of programming languages, compilers, and more broadly <em>system software</em>.
It also means I am asked to advise, mentor, and support others in their research journey, from taking their very first steps, up to becoming their own independent academics, and professors in their own right.
To me, this sounds fun. I am asked to help people learn, pursue knowledge, and develop their skills. Something I not only enjoy, but also find important to prepare the next generation to tackle the problems of our time.
However, this also means I reached the end of a journey.
That’s it. I am a full professor now, and I have convinced enough people that I am not entirely terrible at this job. Or so we all hope…</p>

<p>At this point, I already have to thank all the people at the JKU for the very warm welcome I received over the last few weeks. Particularly, thank you Peter, Herbert, Markus, and Karin, for all the support to get me started here! Similarly, I wouldn’t be here without my dear colleagues and mentors at <a href="https://stefan-marr.de/2025/07/last-day-at-kent/">Kent</a> and in the wider programming language research community. You know who you are, I hope.</p>

<h2 id="what-now">What Now?</h2>

<p>With the new job and responsibilities, I need to think about what’s now important to me.
What follows isn’t a detailed plan.
I had already been asked to formulate one of those, and I’ll continue to work on realizing it.
Instead,
I wanted to think here a bit broader.</p>

<h3 id="teaching-advocate-for-fundamentals">Teaching: Advocate for Fundamentals</h3>

<p>Let’s start with teaching, since my first lectures will already be next week.</p>

<p>Our institute teaches various courses, including software development, compiler construction, advanced compiler construction, system software, dynamic compilation and run-time optimization, and principles of programming languages.</p>

<p>My impression from early discussions with colleagues is that I will need to work on making sure that we can keep teaching these fundamental topics in the future. While there seems to be a very strong push for <em>AI everything</em>, I remain to be convinced that this means that the fundamentals are any less important. On the contrary, it feels that we need to keep reminding people of <em>classic</em> techniques that are guaranteed to work, are correct, and efficient. So, when it comes to teaching, I think an important part of my job will be advocating for the fundamentals.</p>

<p>Of course, looking at the material I’ll teach this term on <a href="https://ssw.jku.at/Teaching/Lectures/CB/VL/">compiler construction</a> and <a href="https://ssw.jku.at/Teaching/Lectures/SSW/">system software</a>, perhaps I can adapt it in future years. Currently, 6 out of 13 compiler construction lectures are on parsing. This makes me want to work out what the most useful learning outcomes for such a course should be today.</p>

<h3 id="research-take-risks-and-pursue-problems-too-hard-for-industry">Research: Take Risks and Pursue Problems Too Hard for Industry</h3>

<p>Some people seem to advocate for exploring new things and expanding one’s horizon when reaching this career level.
Indeed, I have the chance to take risks, explore new research topics and communities, and ways of working.</p>

<p>If there’s a single tag line for the work I have in mind, it might be: improve language implementations to better enable old and new kinds of applications. 
After all, I like to explore ideas that enable developers to make better use of computing systems.</p>

<p>This will take new ways of looking at problems.
For instance, with few exceptions, I have been shying away from very formal work in the past.
Though, a while ago I started dreaming of defining a new kind of high-level memory model, for which we may need a more formal approach in addition to building working prototypes. 
Looking at today’s memory models, they seem too low-level for dynamic languages such as Python and Ruby. I already gave a few talks
about the background of this work and will also give one at <a href="https://conf.researchr.org/details/icfp-splash-2025/sponsor-invited-talks-2025/4/Python-Is-It-Being-Killed-by-Incremental-Improvements-">SPLASH</a>.
This will be a huge project, and a risky one. Not least because it’s unclear whether the language communities care enough about the issue until they start suffering from not having a memory model more notably.</p>

<p>And then there is interpreter performance, a topic I have been working on for a long time already.
Since I am now in a group with a long history in the area of compilers,
I would like to double down on generating fast interpreters.
Interpreters, the way we build them today, have a lot of headroom in terms of performance.
The classic ones, implemented in C/C++, and even more so, the ones on top of meta-compilation systems.
The work of <a href="https://arxiv.org/abs/2411.11469">Haoran Xu</a> suggests that we can do much better.
Unfortunately, it’s a really hard problem, for various reasons.
Something that doesn’t fit into the short and mid-term priorities of most companies.
But we can chip away at it slowly and steadily, benefiting lots of programming languages in the process.</p>

<p>I’ll also continue to work with my colleagues at Oracle on compiler topics
and with colleagues from <a href="https://stefan-marr.de/2025/07/last-day-at-kent/">PLAS</a>. We’ll keep doing fun stuff, some of which we’ll present at SPLASH in two weeks, including work on making <a href="https://stefan-marr.de/2025/08/how-to-slow-down-a-program/">programs slower (yes, slower!)</a> and <a href="https://stefan-marr.de/downloads/oopsla25-burchell-marr-divining-profiler-accuracy.pdf">approximating the ground truth profile for sampling profilers</a>.</p>

<p>I’ll stop here for now. Seems like I do need to get on with the actual job…
somewhere in <a href="https://www.jku.at/campus/der-jku-campus/gebaeude/science-park-3/">Science Park 3</a>.
I am looking forward to starting to work with all my new colleagues at the JKU and seeing which new collaborations and cooperations we can begin.
If you’re a student and interested in a project, please see the <a href="https://ssw.jku.at/Teaching/Projects/open.html">Open Project’s page</a>, where I will post more concrete project ideas in the future.</p>

<p>I suppose I’ll also occasionally still be on 
<a href="https://mastodon.acm.org/@smarr/115297555824308876">Mastodon</a>,
<a href="https://bsky.app/profile/stefan-marr.de/post/3m24gusnpnk2l">BlueSky</a>, and
<a href="https://x.com/smarr/status/1973277801689260347">Twitter</a>.</p>]]></content><author><name></name></author><category term="Personal" /><category term="Personal" /><category term="Linz" /><summary type="html"><![CDATA[It’s Wednesday. Is this important? It’s my first day in a new position. So, perhaps the real question is: what’s going to be important to me from now on?]]></summary></entry><entry><title type="html">How to Slow Down a Program? And Why it Can Be Useful.</title><link href="https://stefan-marr.de/2025/08/how-to-slow-down-a-program/" rel="alternate" type="text/html" title="How to Slow Down a Program? And Why it Can Be Useful." /><published>2025-08-27T12:20:04+02:00</published><updated>2025-08-27T12:20:04+02:00</updated><id>https://stefan-marr.de/2025/08/how-to-slow-down-a-program</id><content type="html" xml:base="https://stefan-marr.de/2025/08/how-to-slow-down-a-program/"><![CDATA[<p>Most research on programming language performance asks a variation of a single question: how can we make some specific program faster?
Sometimes we may even investigate how we can use less memory.
This means a lot of research focuses solely on reducing the amount of resources needed to achieve some computational goal.</p>

<p>So, why on earth might we be interested in slowing down programs then?</p>

<h2 id="slowing-down-programs-is-surprisingly-useful">Slowing Down Programs is Surprisingly Useful!</h2>

<p>Making programs slower can be useful to find race conditions,
to simulate speedups, and to assess how accurate profilers are.</p>

<p>To detect race conditions,
we may want to use an approach similar to fuzzing.
Instead of exploring a program’s implementation
by varying its input,
we can explore different instruction interleavings, thread or event schedules,
by slowing down program parts to change timings.
This approach allows us to identify concurrency bugs
and is used by <a href="https://www.usenix.org/legacy/event/osdi08/tech/full_papers/musuvathi/musuvathi.pdf">CHESS</a>, <a href="https://people.cs.uchicago.edu/~shanlu/paper/eurosys23.pdf">WAFFLE</a>, and <a href="https://drops.dagstuhl.de/storage/00lipics/lipics-vol333-ecoop2025/LIPIcs.ECOOP.2025.9/LIPIcs.ECOOP.2025.9.pdf">NACD</a>.</p>

<p>The <a href="https://github.com/plasma-umass/coz">Coz profiler</a> is an example of how slowing down programs can be used to simulate speedup.
With Coz, we can estimate whether an optimization is beneficial
before implementing it.
Coz simulates it by slowing down <em>all other</em> program parts.
The part we think might be optimizable stays at the same speed
it was before, but is now <em>virtually sped up</em>, which allows us to see
whether it gives enough of a benefit to justify a perhaps lengthy optimization project.</p>

<p>And, as mentioned before, we can also use it to assess how accurate profilers are.
Though, I’ll leave this for the next blog posts. :)</p>

<p>The current approaches to slowing down programs for these use cases are
rather coarse-grained though. Race detection often adapts the scheduler or uses, for example, APIs such as <code class="language-plaintext highlighter-rouge">Thread.sleep()</code>.
Similarly, Coz pauses the execution of the other threads.
<a href="https://plv.colorado.edu/papers/mytkowicz-pldi10.pdf">Work</a> on measuring whether profilers give actionable results,
inserts bytecodes into Java programs to compute Fibonacci numbers.</p>

<p>By using more fine-grained slowdowns,
we think we could make race detection, speedup estimation, and profiler accuracy assessments more precise. Thus, we looked into inserting slowdown instructions into basic blocks.</p>

<h2 id="which-x86-instructions-allow-us-to-consistently-slow-down-basic-blocks">Which x86 Instructions Allow us to Consistently Slow Down Basic Blocks?</h2>

<p>Let’s assume we run on some x86 processor, and we are looking at programs
from the perspective of processors.</p>

<p>When running a benchmark like <a href="https://github.com/smarr/are-we-fast-yet/blob/master/benchmarks/Java/src/Towers.java#L74">Towers</a>,
the OpenJDK’s HotSpot JVM may compile it to x86 instructions like this:</p>

<figure class="highlight"><pre><code class="language-nasm" data-lang="nasm"><table class="rouge-table"><tbody><tr><td class="gutter gl"><pre class="lineno">1
2
3
4
5
6
7
</pre></td><td class="code"><pre><span class="nf">mov</span> <span class="kt">dword</span> <span class="nv">ptr</span> <span class="p">[</span><span class="nb">rsp</span><span class="o">+</span><span class="mh">0x18</span><span class="p">],</span> <span class="nb">r8d</span>
<span class="nf">mov</span> <span class="kt">dword</span> <span class="nv">ptr</span> <span class="p">[</span><span class="nb">rsp</span><span class="p">],</span> <span class="nb">ecx</span>
<span class="nf">mov</span> <span class="kt">qword</span> <span class="nv">ptr</span> <span class="p">[</span><span class="nb">rsp</span><span class="o">+</span><span class="mh">0x20</span><span class="p">],</span> <span class="nb">rsi</span>
<span class="nf">mov</span> <span class="nb">ebx</span><span class="p">,</span> <span class="kt">dword</span> <span class="nv">ptr</span> <span class="p">[</span><span class="nb">rsi</span><span class="o">+</span><span class="mh">0x10</span><span class="p">]</span>
<span class="nf">mov</span> <span class="nb">r9d</span><span class="p">,</span> <span class="nb">edx</span>
<span class="nf">cmp</span> <span class="nb">edx</span><span class="p">,</span> <span class="mh">0x1</span>
<span class="nf">jnz</span> <span class="mi">0</span><span class="nv">x...</span> <span class="o">&lt;</span><span class="nb">Bl</span><span class="nv">ock</span> <span class="mi">55</span><span class="o">&gt;</span>	
</pre></td></tr></tbody></table></code></pre></figure>

<p>This is one of the basic blocks produced by HotSpot’s C2 compiler.
For our purposes, it suffices to see that there are some memory accesses
with the <code class="language-plaintext highlighter-rouge">mov</code> instructions, and we end up checking whether the <code class="language-plaintext highlighter-rouge">edx</code> register
contains the value 1. If that’s not the case, we jump to Block 55.
Otherwise, execution continues in the next basic block.
A key property of a basic block is that there’s no control flow inside of it,
which means once it starts executing, all of its instructions will execute.</p>

<p>Though, how can we slow it down?</p>

<p>x86 has many many different instructions one could try to insert into the block,
which each will probably consume CPU cycles.
However, modern CPUs try to execute as many instructions
as possible at the same time using out-of-order execution.
This means, instructions in our basic block
that do not directly depend on each other
might be executed at the same time.
For instance, the first three <code class="language-plaintext highlighter-rouge">mov</code> instructions access neither the same register
nor memory location. This means the order in which they are executed here does not matter.
Though, which optimizations CPUs apply depends on the program and the specific CPU generation,
or rather microarchitecture.</p>

<p>To find suitable instructions to slow down basic blocks,
we experimented only on an Intel Core i5-10600 CPU,
which has the <a href="https://en.wikipedia.org/wiki/Comet_Lake">Comet Lake-S microarchitecture</a>.
On other microarchitectures, things can be very different.</p>

<p>For the slowdown that we want, 
we can use <code class="language-plaintext highlighter-rouge">nop</code> or <code class="language-plaintext highlighter-rouge">mov regX, regX</code> instructions on Comet Lake-S.
This <code class="language-plaintext highlighter-rouge">mov</code> would move the value from register <code class="language-plaintext highlighter-rouge">X</code> to itself, so basically does nothing.
These two instructions give us a slowdown
that is small enough to slow down most blocks accurately to a desired target speed,
and the slowdown seems to affect only the specific block it is meant for.</p>

<p>Our basic block from earlier would then perhaps end up with <code class="language-plaintext highlighter-rouge">nop</code> instructions
interleaved after each instruction.
In practice, the number of instructions we need to insert
depends on how much time a basic block takes in the program.
Though, for illustration, it might look like this:</p>

<figure class="highlight"><pre><code class="language-nasm" data-lang="nasm"><table class="rouge-table"><tbody><tr><td class="gutter gl"><pre class="lineno">1
2
3
4
5
6
7
8
9
10
11
12
13
</pre></td><td class="code"><pre><span class="nf">mov</span> <span class="kt">dword</span> <span class="nv">ptr</span> <span class="p">[</span><span class="nb">rsp</span><span class="o">+</span><span class="mh">0x18</span><span class="p">],</span> <span class="nb">r8d</span>
<span class="nf">nop</span>
<span class="nf">mov</span> <span class="kt">dword</span> <span class="nv">ptr</span> <span class="p">[</span><span class="nb">rsp</span><span class="p">],</span> <span class="nb">ecx</span>
<span class="nf">nop</span>
<span class="nf">mov</span> <span class="kt">qword</span> <span class="nv">ptr</span> <span class="p">[</span><span class="nb">rsp</span><span class="o">+</span><span class="mh">0x20</span><span class="p">],</span> <span class="nb">rsi</span>
<span class="nf">nop</span>
<span class="nf">mov</span> <span class="nb">ebx</span><span class="p">,</span> <span class="kt">dword</span> <span class="nv">ptr</span> <span class="p">[</span><span class="nb">rsi</span><span class="o">+</span><span class="mh">0x10</span><span class="p">]</span>
<span class="nf">nop</span>
<span class="nf">mov</span> <span class="nb">r9d</span><span class="p">,</span> <span class="nb">edx</span>
<span class="nf">nop</span>
<span class="nf">cmp</span> <span class="nb">edx</span><span class="p">,</span> <span class="mh">0x1</span>
<span class="nf">nop</span>
<span class="nf">jnz</span> <span class="mi">0</span><span class="nv">x...</span> <span class="o">&lt;</span><span class="nb">Bl</span><span class="nv">ock</span> <span class="mi">55</span><span class="o">&gt;</span>	
</pre></td></tr></tbody></table></code></pre></figure>

<p>We tried six different candidates, including a <code class="language-plaintext highlighter-rouge">push</code>-<code class="language-plaintext highlighter-rouge">pop</code> sequence, to get a better impression
of how Comet Lake-S deals with them.
For more details of how and what we tried, please have a look at our <a href="#paper">short paper below</a>, which we will present at the <a href="https://conf.researchr.org/home/icfp-splash-2025/vmil-2025#event-overview">VMIL workshop</a>.</p>

<p>When inserting these instructions into basic blocks,
so that each individual basic block
takes about twice as much time as before,
we end up with a program that indeed is overall twice as slow, as one would hope.
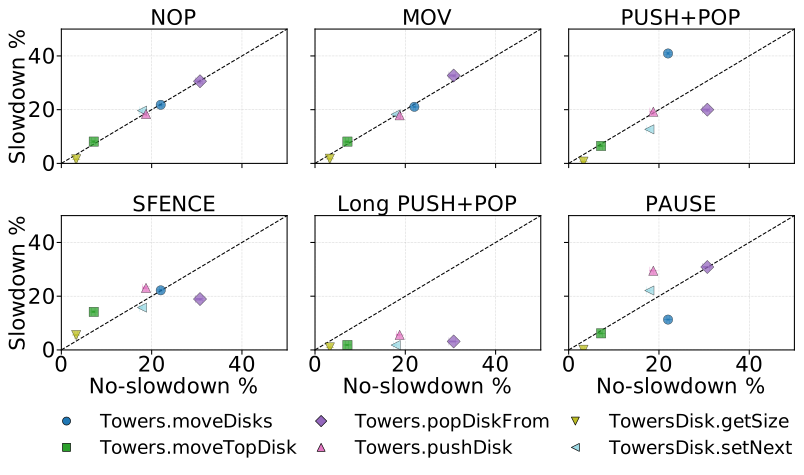
Even better, when we look at the Towers benchmark with the <a href="https://github.com/async-profiler/async-profiler">async-profiler</a> for HotSpot, and compare the proportions of run time it
attributes to each method, the slowed-down and the normal version
match almost perfectly, as <a href="#fig1">illustrated below</a>.
The same is not true for the other candidates we looked at.</p>

<figure id="fig1">
<img src="/assets/2025/08/AsyncSlowdownVsNoSlowdownGrid.svg" height="300" />
<figcaption><strong>Figure 1:</strong> A scatter plot per slowdown instruction with the median run-time percentage for the top six Java methods of Towers. The <em>X=Y</em> diagonal indicates that a method’s run‐time percentage remains the same with and without slowdown.</figcaption>
</figure>

<p>The paper has a few more details, including a more detailed analysis
of the slowdown each candidate introduces,
how precise the slowdown is for all basic blocks
in the benchmark, and whether it makes a difference when we put the slowdown
all at the beginning, interleaved, or at the end.</p>

<p>Of course, this work is merely a stepping stone to more interesting things,
which I will look at in a bit more detail in the next post.</p>

<p>Until then, the paper is linked below, and questions, pointers, and suggestions are welcome on 
<a href="https://mastodon.acm.org/@smarr/115100270023431067">Mastodon</a>,
<a href="https://bsky.app/profile/stefan-marr.de/post/3lxetckoyps2h">BlueSky</a>, or
<a href="https://x.com/smarr/status/1960650722170552800">Twitter</a>.</p>

<p>Update: The <a href="https://youtu.be/xNwup0qn87g">recording of the talk</a> is now on YouTube.</p>

<p><a id="paper"></a></p>

<p><strong>Abstract</strong></p>

<blockquote>
  <p>Slowing down programs has surprisingly many use cases: it helps finding race conditions, enables speedup estimation, and allows us to assess a profiler’s accuracy. Yet, slowing down a program is complicated because today’s CPUs and runtime systems can optimize execution on the fly, making it challenging to preserve a program’s performance behavior to avoid introducing bias.</p>

<p>We evaluate six x86 instruction candidates for controlled and fine-grained slowdown including NOP, MOV, and PAUSE. We tested each candidate’s ability to achieve an overhead of 100%, to maintain the profiler-observable performance behavior, and whether slowdown placement within basic blocks influences results. On an Intel Core i5-10600, our experiments suggest that only NOP and MOV instructions are suitable. We believe these experiments can guide future research on advanced developer tooling that utilizes fine-granular slowdown at the machine-code level.</p>

</blockquote>

<ul>
  <li>Evaluating Candidate Instructions for Reliable Program Slowdown at the Compiler Level: Towards Supporting Fine-Grained Slowdown for Advanced Developer Tooling<br />
    
      
      H. Burchell,
      <em>
      S. Marr</em>;

    
        In Proceedings of the 17th ACM SIGPLAN International Workshop on Virtual Machines and Intermediate Languages,
      

    VMIL'25,
    p. 8,

    ACM,
    2025.

    </li>

    <li>
      Paper:
        <a href="https://stefan-marr.de/downloads/vmil25-burchell-marr-evaluating-candidate-instructions-for-reliable-program-slowdown-at-the-compiler-level.pdf">
          PDF</a>
    </li>

    <li>
        DOI: <a href="https://doi.org/10.1145/3759548.3763374">10.1145/3759548.3763374</a>
    </li>


    <li>
      BibTex:
      <span tabindex="0" class="bibtex"><span class="biblink">bibtex</span>
      <pre>@inproceedings{Burchell:2025:SlowCandidates,
  abstract = {Slowing down programs has surprisingly many use cases: it helps finding race conditions, enables speedup estimation, and allows us to assess a profiler's accuracy. Yet, slowing down a program is complicated because today's CPUs and runtime systems can optimize execution on the fly, making it challenging to preserve a program's performance behavior to avoid introducing bias.
  
  We evaluate six x86 instruction candidates for controlled and fine-grained slowdown including NOP, MOV, and PAUSE. We tested each candidate’s ability to achieve an overhead of 100%, to maintain the profiler-observable performance behavior, and whether slowdown placement within basic blocks influences results. On an Intel Core i5-10600, our experiments suggest that only NOP and MOV instructions are suitable. We believe these experiments can guide future research on advanced developer tooling that utilizes fine-granular slowdown at the machine-code level.},
  author = {Burchell, Humphrey and Marr, Stefan},
  blog = {https://stefan-marr.de/2025/08/how-to-slow-down-a-program/},
  booktitle = {Proceedings of the 17th ACM SIGPLAN International Workshop on Virtual Machines and Intermediate Languages},
  doi = {10.1145/3759548.3763374},
  isbn = {979-8-4007-2164-9/2025/10},
  keywords = {Benchmarking HotSpot ISA Instructions Java MeMyPublication assembly evaluation myown slowdown x86},
  location = {Singapore},
  month = oct,
  pages = {8},
  pdf = {https://stefan-marr.de/downloads/vmil25-burchell-marr-evaluating-candidate-instructions-for-reliable-program-slowdown-at-the-compiler-level.pdf},
  publisher = {{ACM}},
  series = {VMIL'25},
  title = {{Evaluating Candidate Instructions for Reliable Program Slowdown at the Compiler Level: Towards Supporting Fine-Grained Slowdown for Advanced Developer Tooling}},
  year = {2025},
  month_numeric = {10}
}
</pre>
      </span>
    </li>
</ul>]]></content><author><name></name></author><category term="Research" /><category term="Java" /><category term="Benchmarking" /><category term="Research" /><category term="Profilers" /><category term="Sampling" /><category term="Instrumentation" /><category term="Tooling" /><category term="paper" /><summary type="html"><![CDATA[Most research on programming language performance asks a variation of a single question: how can we make some specific program faster? Sometimes we may even investigate how we can use less memory. This means a lot of research focuses solely on reducing the amount of resources needed to achieve some computational goal.]]></summary></entry><entry><title type="html">It’s Thursday, and My Last* Day at Kent</title><link href="https://stefan-marr.de/2025/07/last-day-at-kent/" rel="alternate" type="text/html" title="It’s Thursday, and My Last* Day at Kent" /><published>2025-07-31T10:54:08+02:00</published><updated>2025-07-31T10:54:08+02:00</updated><id>https://stefan-marr.de/2025/07/last-day-at-kent</id><content type="html" xml:base="https://stefan-marr.de/2025/07/last-day-at-kent/"><![CDATA[<p>Today is the 31st of July 2025, and from tomorrow on I’ll be “between jobs”, or as Gen Z allegedly calls it, on a micro-retirement.</p>

<p>When I first came to Kent for my interview, I was thinking, I’ll do this one for practice.
I still had more than 2 years left on a research grant we just got, which promised to be lots of fun, but academic jobs for PL systems people are rare, even rarer these days.
But then I got the call from Richard Jones, offering me the position, and I never regretted taking him up on it.</p>

<p>Kent’s School of Computing was just growing its <a href="https://research.kent.ac.uk/programming-languages-systems/">Programming Languages and Systems (PLAS) group</a> and Richard, Simon Thompson, Andy King, Peter Rodgers, and many others at the School did a remarkable job in creating an environment and community that was truly supportive of young academics taking their first steps in a permanent academic post. Be it about wrestling with teaching duties, papers, reviews, reviewers, and of course grant writing. PLAS and the School of Computing was the right place for me.</p>

<p>Of course, many things changed since my start in October 2017. Perhaps most notably, Computing is now in the Kennedy building, a very nice space. But there was also that moment, where we, the young ones, became the “senior” ones. Mark, Laura, and Dominic grew well into their new roles and I can only hope that I passed on some of the extensive support I got, to the people who started after me.</p>

<p>There are many challenges ahead for my dear colleagues at Kent, but I hope, that enough of the spirit of support and community remains in the School, enabling PLAS and the next generation of academics to do great things.</p>

<p>Also a huge <em>thank you</em> to Kemi, Anna, and Janet for keeping the School afloat.</p>

<p>I’ll miss you all. Thanks for everything! And see you soon!</p>

<figure class="full"><img src="/assets/2025/07/PLAS-2023-10.jpg" />
<figcaption>Most of PLAS in October 2023</figcaption></figure>

<p><strong>*</strong> It’s a little more complicated than that, but for good reasons. Right, EPSRC? :)</p>]]></content><author><name></name></author><category term="Personal" /><category term="Personal" /><category term="Canterbury" /><summary type="html"><![CDATA[Today is the 31st of July 2025, and from tomorrow on I’ll be “between jobs”, or as Gen Z allegedly calls it, on a micro-retirement.]]></summary></entry><entry><title type="html">Instrumentation-based Profiling on JVMs is Broken!</title><link href="https://stefan-marr.de/2024/09/instrumenation-based-profiling-on-jvms-is-broken/" rel="alternate" type="text/html" title="Instrumentation-based Profiling on JVMs is Broken!" /><published>2024-09-17T11:08:10+02:00</published><updated>2024-09-17T11:08:10+02:00</updated><id>https://stefan-marr.de/2024/09/instrumenation-based-profiling-on-jvms-is-broken</id><content type="html" xml:base="https://stefan-marr.de/2024/09/instrumenation-based-profiling-on-jvms-is-broken/"><![CDATA[<p>Last year, we <a href="https://stefan-marr.de/2023/09/dont-blindly-trust-your-profiler/">looked at how well sampling profilers work on top of the JVM</a>.
Unfortunately, they suffer from issues such as safepoint bias and may not correctly attribute observed run time to the correct methods because of the complexities introduced by inlining and other compiler optimizations.</p>

<p>After looking at sampling profilers, <a href="https://github.com/HumphreyHCB">Humphrey</a> started to investigate instrumentation-based profilers and found during his initial investigation that they were giving much more consistent numbers. Unfortunately, it became quickly clear that the state-of-the-art instrumentation-based profilers on the JVM also have major issues, which results in profiles that are not representative of production performance. Since profilers are supposed to help us identify performance issues, they fail at their one job.</p>

<p>When investigating them further, we found that they interact badly with inlining and other standard optimizations. Because the profilers we found instrument JVM bytecodes, they add a lot of extra code that compiler optimizations treat as any other application code.
While this does not strictly prevent optimizations such as inlining, the extra code interferes enough with the optimization that the observable behavior of a program with and without inlining is basically identical.
In practice, this means that instrumentation-based profilers on the JVM are easily portable, but they can’t effectively guide developers to the code that would benefit most from attention, which is their main purpose.</p>

<h3 id="profilers-that-do-not-capture-production-performance-will-misguide-us">Profilers that do not capture production performance will misguide us!</h3>

<p>While they can still identify the code that is activated most often, the interaction with optimizations means that developers see mostly unoptimized behavior.
With today’s highly optimizing compilers this is unfortunate, because we may end up optimizing code that the compiler normally would have optimized for us already, and we spend time on things that likely won’t make a difference in production.</p>

<p>Let’s look at an example from our paper:</p>

<figure class="highlight"><pre><code class="language-java" data-lang="java"><span class="kd">class</span> <span class="nc">ActionA</span> <span class="o">{</span> <span class="kt">int</span> <span class="n">id</span><span class="o">;</span> <span class="kt">void</span> <span class="nf">execute</span><span class="o">()</span> <span class="o">{}</span> <span class="o">}</span>
<span class="kd">class</span> <span class="nc">ActionB</span> <span class="o">{</span> <span class="kt">int</span> <span class="n">id</span><span class="o">;</span> <span class="kt">void</span> <span class="nf">execute</span><span class="o">()</span> <span class="o">{}</span> <span class="o">}</span>
<span class="kt">var</span> <span class="n">actions</span> <span class="o">=</span> <span class="n">getMixOfManyActions</span><span class="o">();</span>
<span class="n">bubbleSortById</span><span class="o">(</span><span class="n">actions</span><span class="o">);</span>
<span class="n">framework</span><span class="o">.</span><span class="na">execute</span><span class="o">(</span><span class="n">actions</span><span class="o">);</span></code></pre></figure>

<p>In this arguably a little contrived example, we use some kind of framework,
for which we have actions that the framework applies for us.
This is probably a worst case for profilers that instrument bytecodes.
Here, the <code class="language-plaintext highlighter-rouge">execute()</code> methods would be identified as the most problematic
aspect. Though, they don’t do anything.
A just-in-time compiler like HotSpot’s C2,
would likely end up seeing a bimorphic call site to <code class="language-plaintext highlighter-rouge">execute()</code> and inline both methods.
And if the compiler heuristics are with us, it might even optimize out the empty loop
in the framework.</p>

<p>So, if we assume a sufficiently smart compiler, here our inefficient code,
that’s forced on us by a framework, is being taken care of by the compiler.
And a good profiler, would ideally guide us to the <code class="language-plaintext highlighter-rouge">bubbleSortById(.)</code> as being of interest.
Typically, we’d expect to get a good speedup here by switching to a more suitable
sort, especially since we implicitly assume there are many actions so that this code matters
in production.</p>

<p>To me this means, instrumentation-based profilers can only be a matter of last resort when sampling with its own flaws fails. They are just not useful enough as they are.</p>

<h3 id="can-we-do-better-than-profilers-that-instrument-bytecode">Can we do better than profilers that instrument bytecode?</h3>

<p>At the time, Humphrey was quite in favor of instrumentation,
because it gives very consistent results.
So, he wanted to make the results of instrumentation-based profilers more realistic.
Inspired by the work of <a href="https://dl.acm.org/doi/10.1145/3591473">Basso et al.</a>,
he built an instrumentation-based profiler into the Graal just-in-time compiler
that works more like classic instrumentation-based profilers for ahead-of-time-compiled language implementations.</p>

<p>The basic idea is <a href="#fig1">illustrated below</a>:</p>

<figure id="fig1">
<img src="/assets/2024/09/inst-based/Compiler-Phase-Instrumentation.svg" width="440" />
<figcaption><strong>Figure 1:</strong> Instrumentation-based profilers on the JVM typically insert instrumentation very early, before compilers optimize code.
In our profiler, instrumentation is inserted very late, to minimize interfering with optimizations.
</figcaption>
</figure>

<p>Instead of inserting the instrumentation right when the bytecode is loaded,
for instance with an <a href="https://docs.oracle.com/javase/8/docs/api/java/lang/instrument/package-summary.html">agent</a> or some other form of bytecode rewriting,
we move the addition of instrumentation code to a much later part of the just-in-time compilation. Most importantly, we insert it only after inlining and most optimizations are performed.
To keep the prototype simple, we insert the probes right before it is turned into the lower level IR.
At this point, there are still a few optimizations to be performed, including instruction selection and register allocation. Though, in the grand scheme of things, these are minor.</p>

<h3 id="how-much-better-is-it">How much better is it?</h3>

<p>With his prototype, Humphrey managed to achieve not only much better performance than classic instrumentation-based profilers, but also minimize interference with optimizations.
For a rough idea of the overall performance impact of this approach,
let’s have a look at <a href="#fig2">Figure 2</a>:</p>

<figure id="fig2">
<img src="/assets/2024/09/inst-based/Overhead-BoxPlot-Logarithmic.svg" width="440" />
<figcaption><strong>Figure 12:</strong> Sampling-based profilers such as Async, Honest, JFR,
Perf, and YourKit (in sampling mode) have very low overhead, though suffer from safepoint bias
and only observe samples.
YourKit and JProfiler doing instrumentation introduce overhead of two orders of magnitudes
and lead to unrealistic results because of their impact on optimizations.
Bubo, our prototype, has much lower overhead, and does not interfere with optimizations.
</figcaption>
</figure>

<p>With a few extra tricks briefly sketched in the paper, we get good attribution of where time is spent, even in the presence of inlining, reduce overhead, and benefit from the more precise results of instrumentation, because it does not have the same drawbacks of only occasionally obtaining data.</p>

<p>There’s one major open question though: what does a correct profile look like?
At the moment, we can’t assess whether our approach is correct.
Sampling profilers, as we saw <a href="https://stefan-marr.de/2023/09/dont-blindly-trust-your-profiler/">last year</a>, also do not agree on a single answer.
So, while we believe our approach is much better than classic instrumentation, we still need to find out how correct it is.</p>

<p>All results so far, and a few more technical details are in the paper linked below.
Questions, pointers, and suggestions are greatly appreciated
perhaps on 
<a href="https://mastodon.acm.org/@smarr/113152217131389091">Mastodon</a> or
Twitter <a href="https://x.com/smarr/status/1835976792668061978">@smarr</a>.</p>

<p><a id="paper"></a></p>

<p><strong>Abstract</strong></p>

<blockquote>
  <p>Profilers are crucial tools for identifying and improving application performance. However, for language implementations with just-in-time (JIT) compilation, e.g., for Java and JavaScript, instrumentation-based profilers can have significant overheads and report unrealistic results caused by the instrumentation.</p>

<p>In this paper, we examine state-of-the-art instrumentation-based profilers for Java to determine the realism of their results. We assess their overhead, the effect on compilation time, and the generated bytecode. We found that the profiler with the lowest overhead increased run time by 82x. Additionally, we investigate the realism of results by testing a profiler’s ability to detect whether inlining is enabled, which is an important compiler optimization. Our results document that instrumentation can alter program behavior so that performance observations are unrealistic, i.e., they do not reflect the performance of the uninstrumented program.</p>

<p>As a solution, we sketch late-compiler-phase-based instrumentation for just-in-time compilers, which gives us the precision of instrumentation-based profiling with an overhead that is multiple magnitudes lower than that of standard instrumentation-based profilers, with a median overhead of 23.3% (min. 1.4%, max. 464%). By inserting probes late in the compilation process, we avoid interfering with compiler optimizations, which yields more realistic results.</p>

</blockquote>

<ul>
  <li>Towards Realistic Results for Instrumentation-Based Profilers for JIT-Compiled Systems<br />
    
      
      H. Burchell,
      
      O. Larose,
      <em>
      S. Marr</em>;

    
        In Proceedings of the 21st ACM SIGPLAN International Conference on Managed Programming Languages and Runtimes,
      

    MPLR'24,
    

    ACM,
    2024.

    </li>

    <li>
      Paper:
        <a href="https://stefan-marr.de/downloads/mplr24-burchell-et-al-towards-realistic-results-for-instrumentation-based-profilers-for-jit-compiled-systems.pdf">
          PDF</a>
    </li>

    <li>
        DOI: <a href="https://doi.org/10.1145/3679007.3685058">10.1145/3679007.3685058</a>
    </li>


    <li>
      BibTex:
      <span tabindex="0" class="bibtex"><span class="biblink">bibtex</span>
      <pre>@inproceedings{Burchell:2024:InstBased,
  abstract = {Profilers are crucial tools for identifying and improving application performance. However, for language implementations with just-in-time (JIT) compilation, e.g., for Java and JavaScript, instrumentation-based profilers can have significant overheads and report unrealistic results caused by the instrumentation.
  
  In this paper, we examine state-of-the-art instrumentation-based profilers for Java to determine the realism of their results. We assess their overhead, the effect on compilation time, and the generated bytecode. We found that the profiler with the lowest overhead increased run time by 82x. Additionally, we investigate the realism of results by testing a profiler’s ability to detect whether inlining is enabled, which is an important compiler optimization. Our results document that instrumentation can alter program behavior so that performance observations are unrealistic, i.e., they do not reflect the performance of the uninstrumented program.
  
  As a solution, we sketch late-compiler-phase-based instrumentation for just-in-time compilers, which gives us the precision of instrumentation-based profiling with an overhead that is multiple magnitudes lower than that of standard instrumentation-based profilers, with a median overhead of 23.3% (min. 1.4%, max. 464%). By inserting probes late in the compilation process, we avoid interfering with compiler optimizations, which yields more realistic results.},
  author = {Burchell, Humphrey and Larose, Octave and Marr, Stefan},
  blog = {https://stefan-marr.de/2024/09/instrumenation-based-profiling-on-jvms-is-broken/},
  booktitle = {Proceedings of the 21st ACM SIGPLAN International Conference on Managed Programming Languages and Runtimes},
  doi = {10.1145/3679007.3685058},
  keywords = {Graal Instrumentation JVM Java MeMyPublication Optimization Profiler Profiling Sampling myown},
  month = sep,
  pdf = {https://stefan-marr.de/downloads/mplr24-burchell-et-al-towards-realistic-results-for-instrumentation-based-profilers-for-jit-compiled-systems.pdf},
  publisher = {ACM},
  series = {MPLR'24},
  title = {{Towards Realistic Results for Instrumentation-Based Profilers for JIT-Compiled Systems}},
  year = {2024},
  month_numeric = {9}
}
</pre>
      </span>
    </li>
</ul>]]></content><author><name></name></author><category term="Research" /><category term="Java" /><category term="Benchmarking" /><category term="Research" /><category term="Profilers" /><category term="Sampling" /><category term="Instrumentation" /><category term="Tooling" /><category term="paper" /><summary type="html"><![CDATA[Last year, we looked at how well sampling profilers work on top of the JVM. Unfortunately, they suffer from issues such as safepoint bias and may not correctly attribute observed run time to the correct methods because of the complexities introduced by inlining and other compiler optimizations.]]></summary></entry></feed>